Join the PU Xtrader Challenge Today
Trade with simulated capital and earn real profits after you pass our trader assessment.
Join the PU Xtrader Challenge Today
Trade with simulated capital and earn real profits after you pass our trader assessment.
28 March 2024,04:22
Daily Market AnalysisMarket Insights
28 March 2024, 04:22
* Dollar and Gold price poise ahead of crucial U.S. GDP reading.
* U.S. Equity market spurs up at the end of the quarter.
* Oil prices are stimulated by OPEC+ supply cut extension and heightened geopolitical uncertainties.
Fundamental Overview
The dollar index (DXY) advanced marginally today, buoyed by anticipation surrounding the upcoming release of the U.S. Gross Domestic Product (GDP) data. However, investors are monitoring a slight easing in the U.S. long-term treasury yield from its recent peak at 4.30%, which could exert downward pressure on the dollar’s resilience. Meanwhile, Wall Street witnessed a robust performance, with the Dow Jones leading the charge with gains exceeding 1% yesterday, driven by institutional portfolio rebalancing at the quarter-end and heightened enthusiasm for equities.
In the commodities sector, gold prices remained steady at elevated levels, as investors awaited the release of the U.S. GDP data and Friday’s Personal Consumption Expenditures (PCE) reading, both of which are poised to have a direct impact on gold prices. Despite a notable increase in U.S. crude stockpiles, oil prices climbed during the previous session. The decision by OPEC+ to extend supply cuts has overshadowed concerns about demand in the U.S., bolstering oil market sentiment.
Furthermore, Bitcoin (BTC) maintained support above the $69,000 mark, with open interest resurging above $20 billion, indicating renewed enthusiasm among BTC traders. Investors are closely monitoring these developments across asset classes, as they assess potential market implications amid ongoing volatility and uncertainty.
Current rate hike bets on 1st May Fed interest rate decision:
Source: CME Fedwatch Tool
0 bps (90%) VS -25 bps (10%)
(MT4 System Time)

Source: MQL5
(MT4 System Time)

Source: MQL5
Market Movements
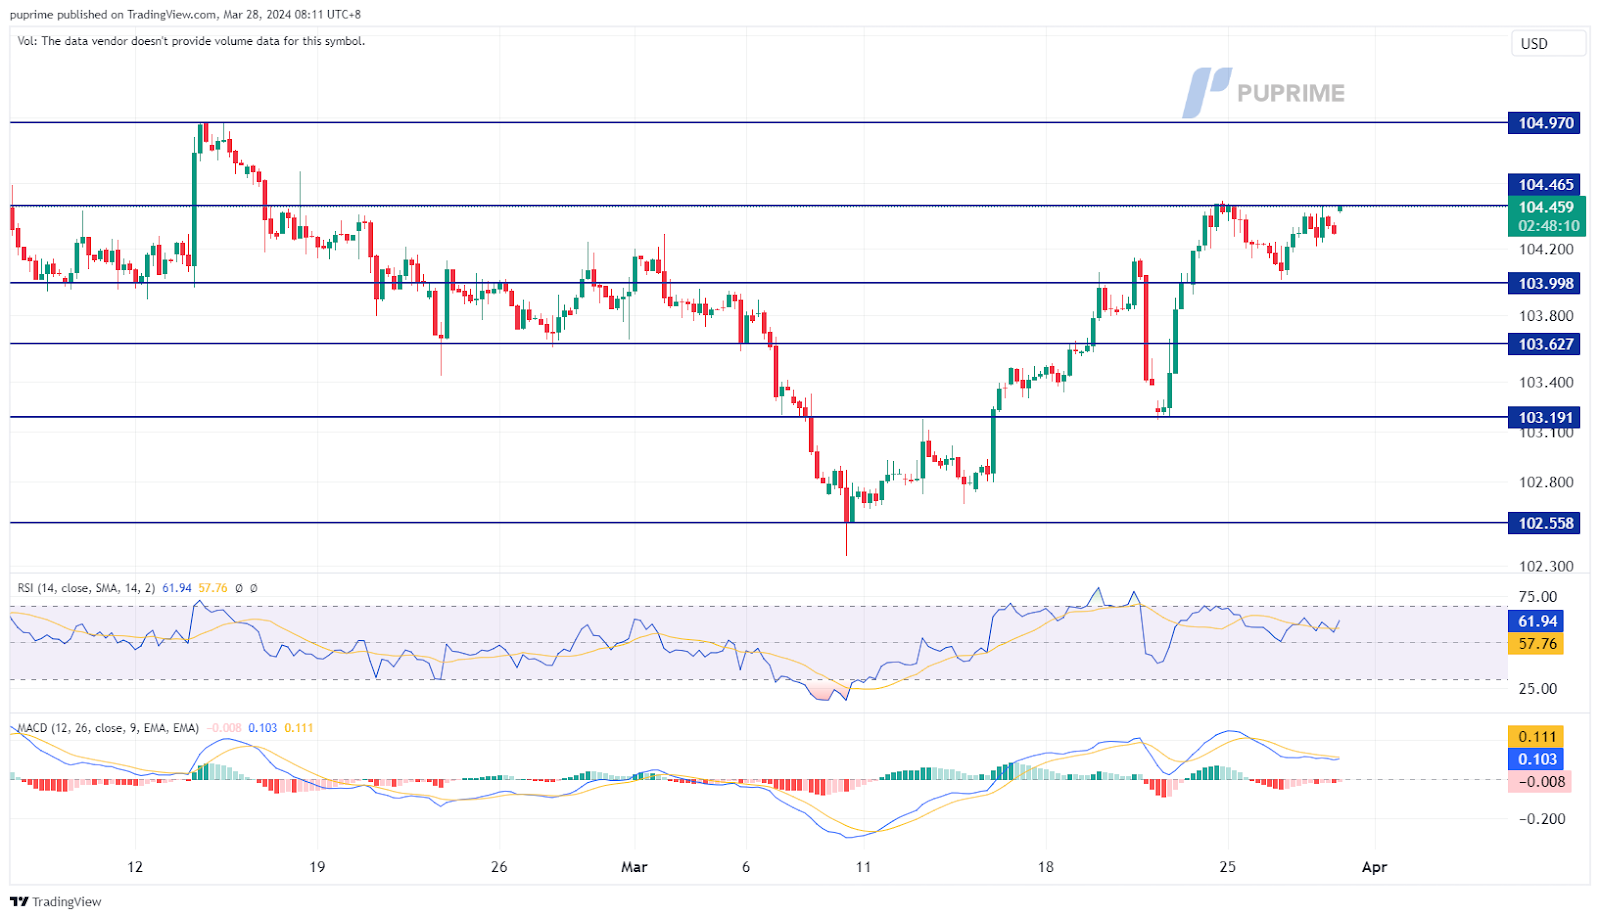
DOLLAR_INDX, H4
The Dollar Index (DXY) is currently oscillating near its recent peak, challenging the resistance threshold at 104.45, as market participants keenly await the forthcoming U.S. Gross Domestic Product (GDP) data. This pivotal economic metric is anticipated to be a significant determinant of the dollar’s trajectory, offering insights into the vigor of the U.S. economy. Moreover, the spotlight is also on Friday’s Personal Consumption Expenditures (PCE) index, a critical measure for projecting the Federal Reserve’s future monetary policy directions.
The Dollar Index is on the brink of breaking its recent high level at 104.45, suggesting a bullish bias for the index. The RSI remained at the higher region while the MACD observed a sliding manner, suggesting the bullish momentum is easing slightly.
Resistance level: 104.45, 104.95
Support level:104.00, 103.65
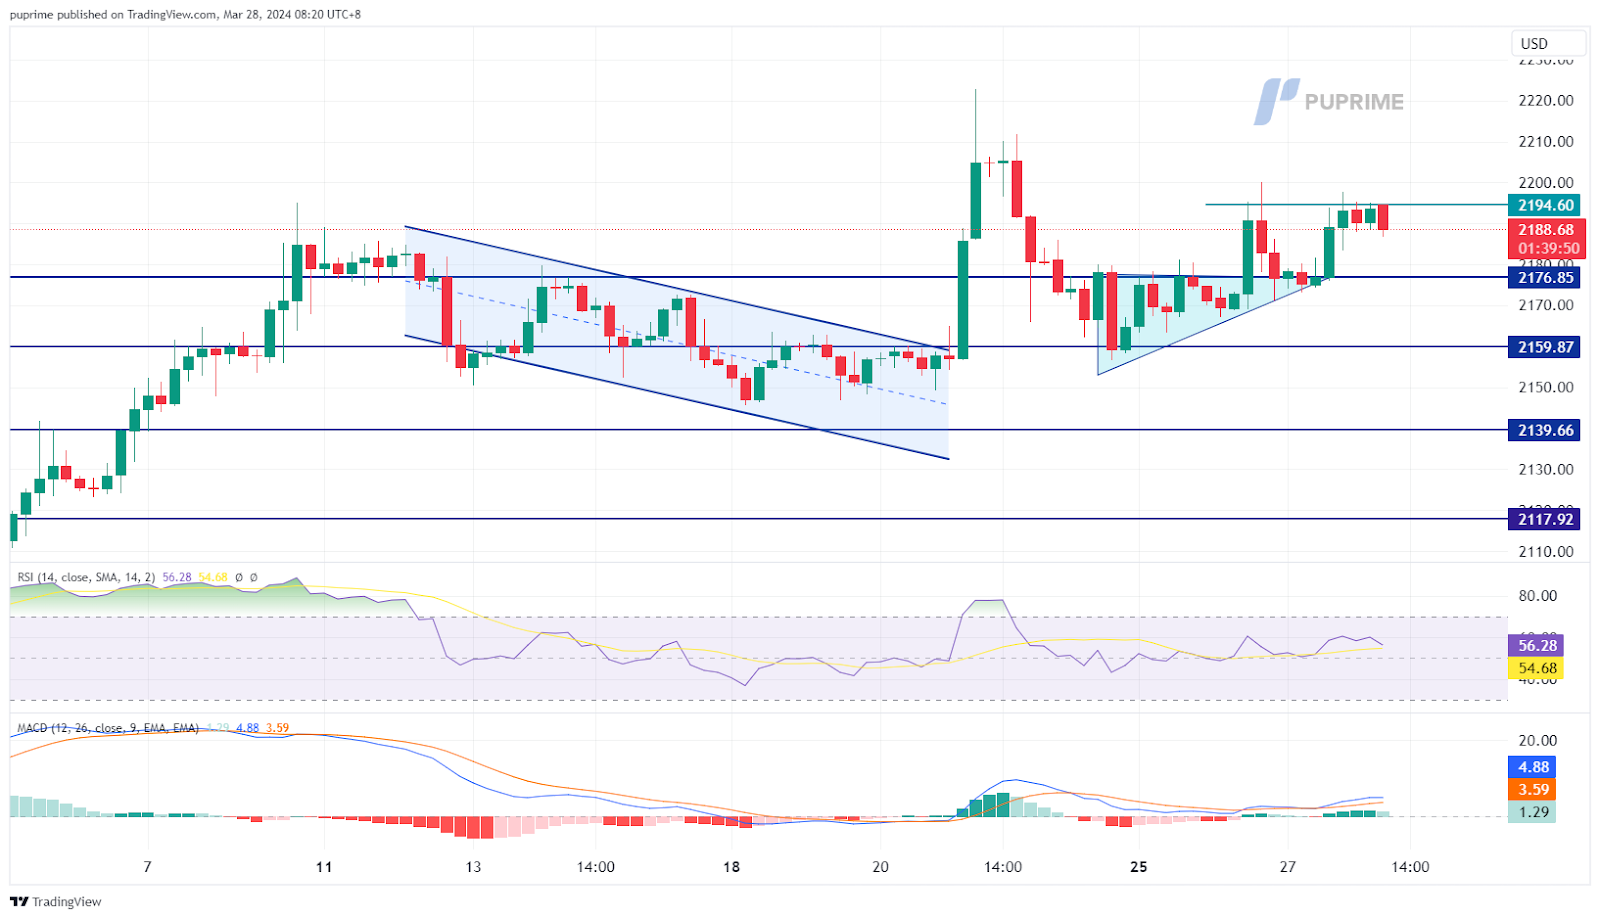
Gold prices are on the rise, approaching the pivotal psychological barrier of $2200, reflecting a proactive stance among market participants in anticipation of pivotal economic indicators. This upward trajectory is predominantly fueled by strategic positioning by traders and investors ahead of key U.S. economic data releases. Notably, attention is focused on today’s Gross Domestic Product (GDP) figures and tomorrow’s Personal Consumption Expenditures (PCE) index, both of which are anticipated to provide crucial insights into the state of the U.S. economy.
Gold prices hovering at the $2195 level after breaking above the ascending triangle pattern suggest a bullish bias for gold. The RSI is hovering near the overbought zone, while the MACD shows signs of rebounding from above the zero line, suggesting the bullish momentum remains intact.
Resistance level: 2195.00, 2230.00
Support level: 2175.00, 2160.00
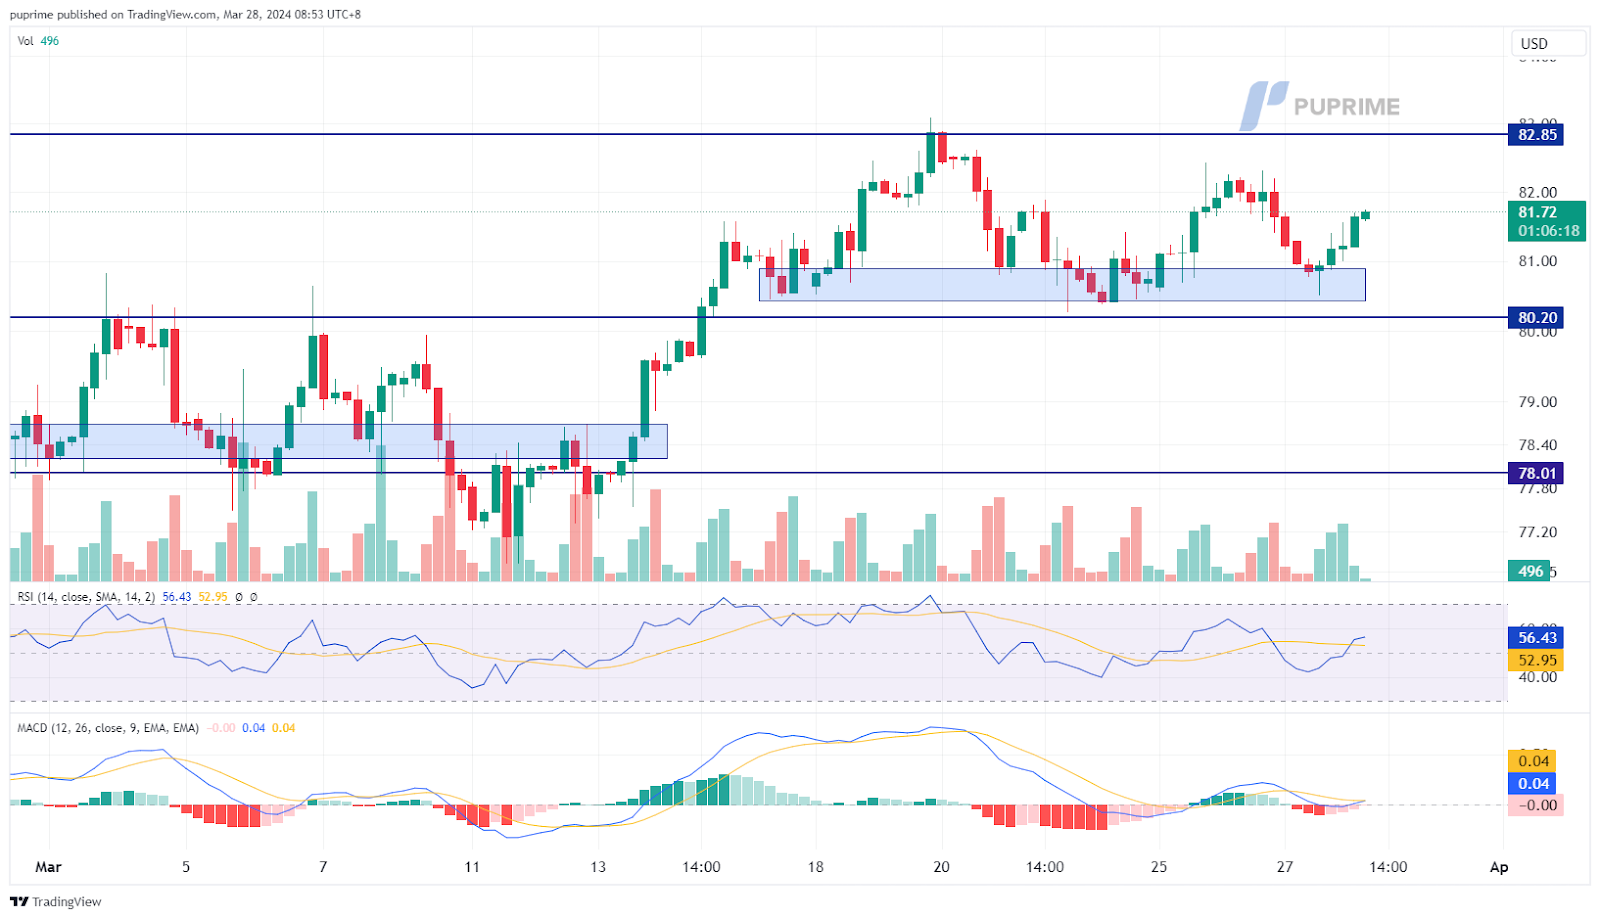
Crude oil prices have rebounded from recent lows, although they have yet to reclaim their previous peaks, indicating a lack of clear trend reversal. This resurgence comes despite the release of U.S. weekly crude stockpile data, which showed a notable increase compared to the previous reading. However, geopolitical tensions in both the Eurozone and the Middle East have supported oil prices, along with the decision by OPEC+ to extend oil production cuts until the end of June.
Oil prices rebounded above their liquidity zone, suggesting the oil price is trading with a bullish trajectory. The RSI hovers between the 50 level while the MACD flows closely toward the zero line, with both indicators giving a neutral signal for oil prices.
Resistance level: 82.85, 84.10
Support level: 80.20, 78.00

Trade with simulated capital and earn real profits after you pass our trader assessment.

20 May 2025, 06:46 Gold Slips as Ceasefire Hopes Curb Safe-Haven Demand

7 May 2025, 03:59 Geopolitical Risks and FOMC Uncertainty Shake Global Markets

6 May 2025, 05:53 Dollar Dips, Gold Rallies on U.S.-Taiwan Risk


New Registrations Unavailable
We’re not accepting new registrations at the moment.
While new sign ups are unavailable, existing users can continue their challenges and trading activities as usual.
Disclaimer: This website exclusively provides proprietary trading services. We do not engage in any regulated activities, offer investment management services, or manage funds on behalf of external clients. Our trading activities are conducted solely with the firm's own capital, and we do not accept client deposits or manage client accounts. It's important to note that none of the services we provide should be construed as investment or financial services in accordance with applicable laws.
This website offers services related to professional skill and experience assessment, which determine your eligibility to trade with the firm's capital. The outcome of these services is inherently determined by your individual skill level and ability to perform within the trading requirements and objectives outlined for each service separately. Clients are strongly advised to thoroughly understand the requirements of the services before signing up for any.
The content provided on this website is for informational purposes only and does not constitute financial, investment, or trading advice. The information presented is based on sources believed to be reliable, but we do not guarantee its accuracy, completeness, or timeliness. We disclaim any liability for any loss or damage arising directly or indirectly from the use of or reliance on the information provided on this website.
This website is not directed to residents of certain jurisdictions such as the United States, Singapore, Australia, China and some other specified regions, and is not intended for distribution to, or use by, any person in any countries or jurisdictions where such distribution or use would be contrary to local law or regulation.
This website is owned by Finzero Cap Ltd, a company incorporated in the Republic of Cyprus under registration number HE414308, with its registered office at 62 Athalassas, Mezzanine, Strovolos 2012, Nicosia, Cyprus. Finzero Cap Ltd serves as the authorized representative for PU Prime Ltd.
