Join the PU Xtrader Challenge Today
Trade with simulated capital and earn real profits after you pass our trader assessment.
Join the PU Xtrader Challenge Today
Trade with simulated capital and earn real profits after you pass our trader assessment.
2 April 2024,05:44
Daily Market AnalysisMarket Insights
2 April 2024, 05:44
* Dollar index (DXY) rose to its highest level since last November, bolstered by upbeat economic data.
* Australian dollar hammered by dovish March meeting minutes.
* Gold bullish trend hindered by strong dollar while oil prices continue to edge higher.
The Dollar Index (DXY) experienced a notable increase of nearly 0.5% in the latest session, driven by the robust ISM PMI data which eclipsed the pivotal 50-point mark, indicating ongoing economic expansion in the U.S. Federal Reserve Chair Jerome Powell’s somewhat dovish comments last Friday, after the PCE data met expectations, have heightened anticipation for a possible rate increase in June. Meanwhile, the recently disclosed minutes from the RBA’s meeting indicated that the Reserve Bank of Australia had not considered a rate hike in its last gathering. Market analysts view this as an indication that the RBA might have ended its cycle of rate increases, casting a shadow over the Australian dollar, especially during the opening of the Asia market session.
In the realm of commodities, gold prices experienced sideways movement, influenced by the dollar’s strengthening, and remained near their all-time high levels. On the other hand, oil prices saw a continued rise, fueled by expectations of tighter supply and escalating geopolitical tensions in Europe and the Middle East.
Current rate hike bets on 1st May Fed interest rate decision:
Source: CME Fedwatch Tool
0 bps (85.5%) VS -25 bps (14.5%)
(MT4 System Time)

Source: MQL5
(MT4 System Time)

Source: MQL5
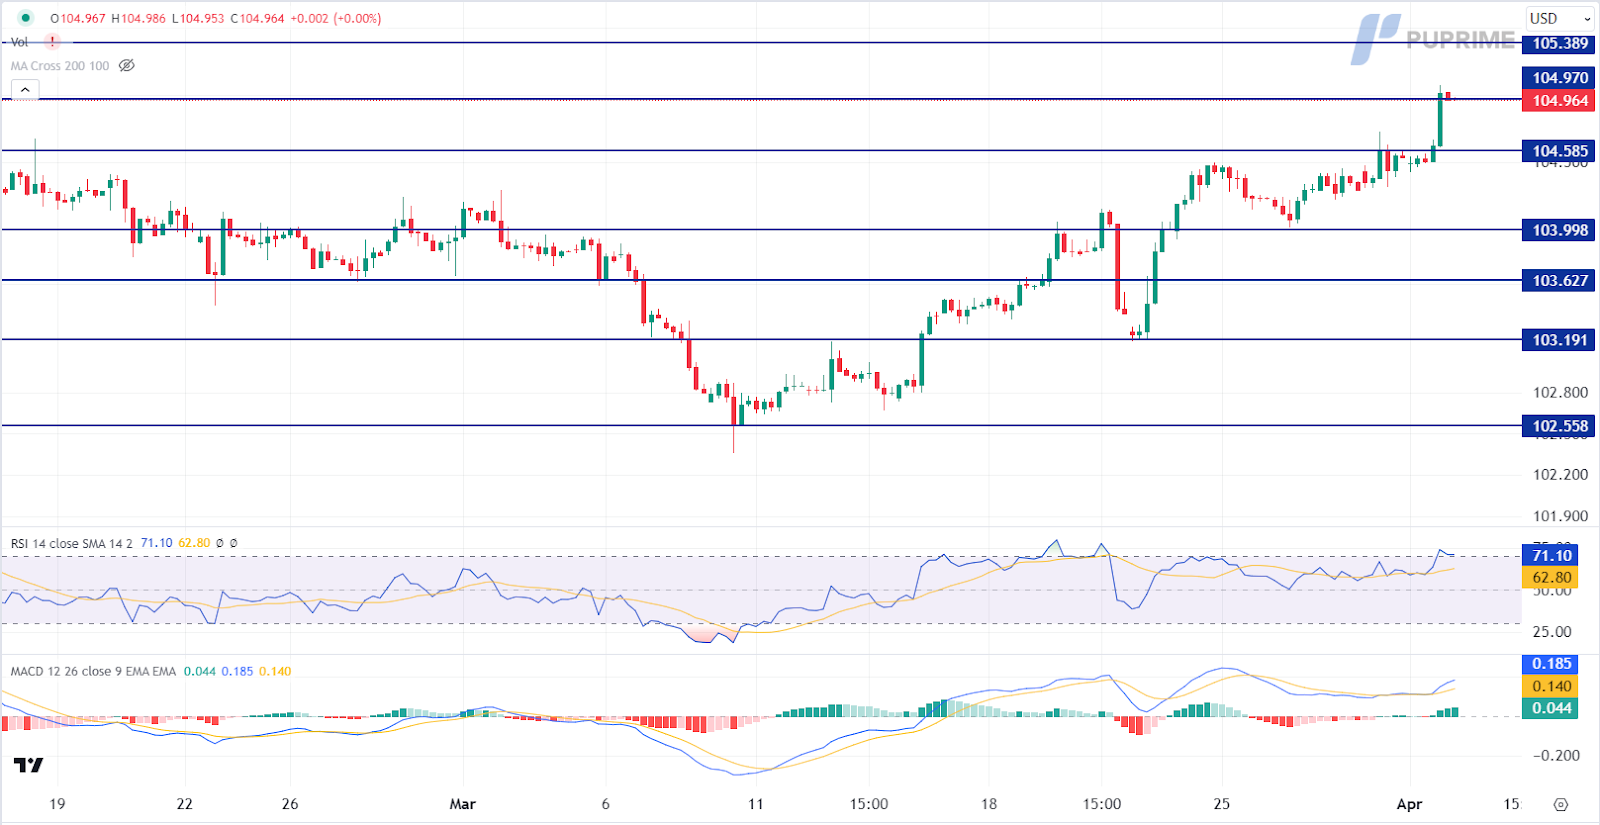
The Dollar Index continued its upward trajectory against major currencies, driven by better-than-expected US economic indicators, which dampened expectations for imminent rate cuts from the Federal Reserve. Surging US Treasury yields further strengthened demand for the US Dollar, indicating market confidence in the economy’s resilience. Robust readings from the ISM Manufacturing Prices and PMI also contributed to the greenback’s strength, leading to a decrease in the probabilities of rate cuts, as shown by the CME FedWatch Tool.
Currently, the Dollar Index is trading higher and testing the resistance level. The MACD indicator shows increasing bullish momentum. However, the RSI stands at 71, suggesting the potential for the index to enter overbought territory.
Resistance level: 104.95, 105.40
Support level:104.60, 104.00
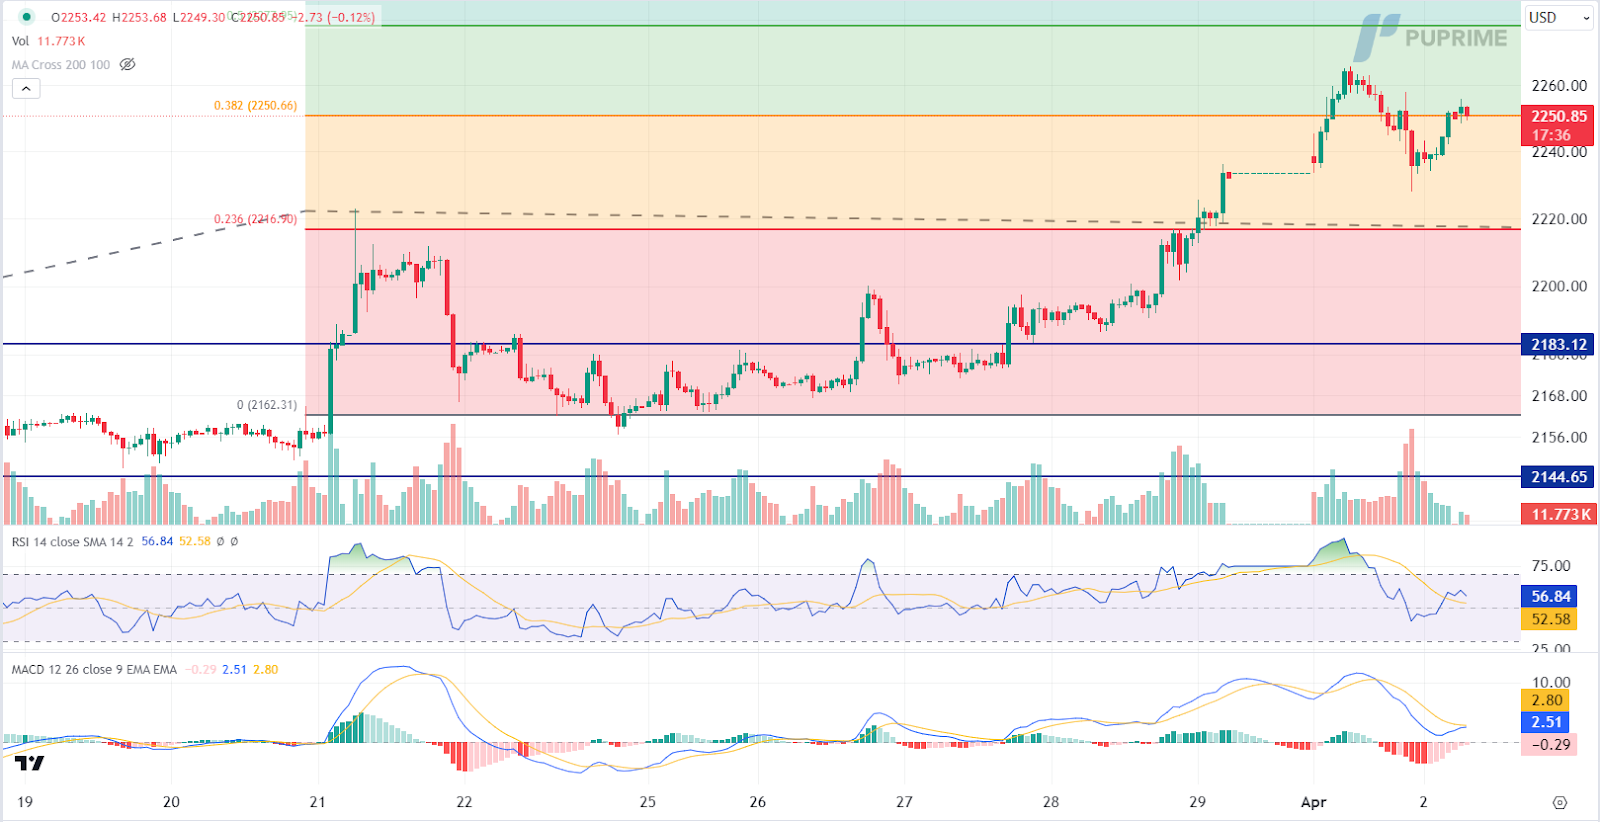
Gold prices experienced a slight retreat as investors engaged in profit-taking activities amidst a stronger US Dollar. Optimistic economic data from the US bolstered the country’s positive economic outlook, prompting investors to shift focus towards the Dollar. However, lingering geopolitical tensions in the Middle East and upcoming US elections may introduce market uncertainties, potentially limiting gold’s losses in the long term.
Currently, gold prices are trading flat and testing the resistance level. The MACD indicator shows diminishing bearish momentum, while the RSI stands at 57, suggesting the potential for the commodity to extend its gains after breakout, as the RSI remains above the midline.
Resistance level: 2250.00, 2280.00
Support level: 2215.00, 2185.00
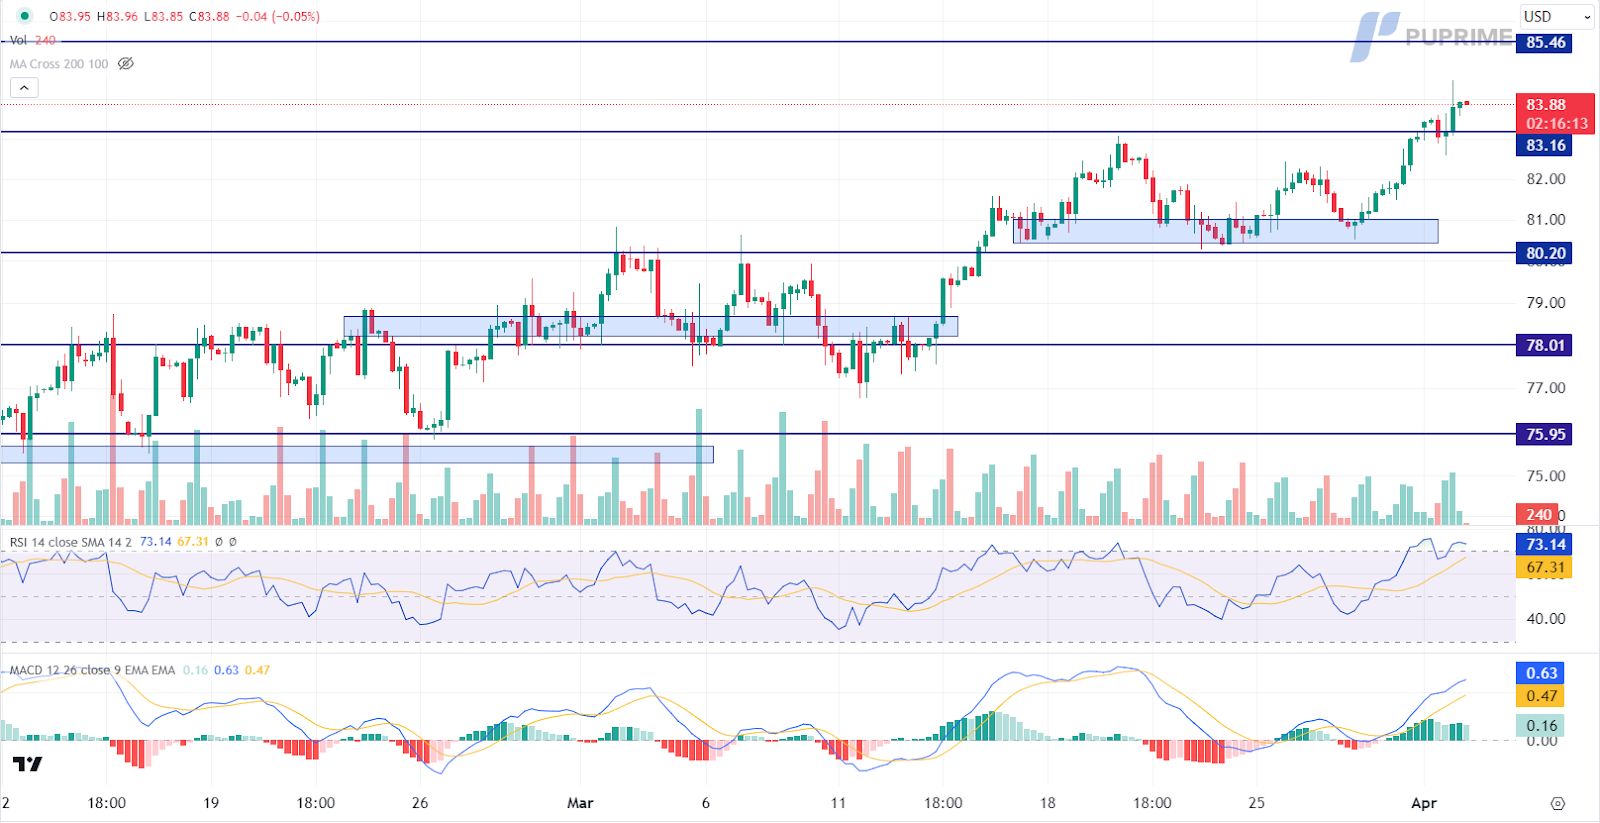
Oil prices climbed higher on reports of heightened geopolitical tensions in the Middle East, with Israel striking an Iranian consulate in Syria. These developments sparked concerns over tighter global supplies, boosting oil prices ahead of the upcoming OPEC+ meeting. Investors eagerly anticipate the gathering, where discussions on supply and demand dynamics, as well as adherence to output cuts, are expected to influence market sentiment.
Currently, oil prices are trading higher after breaking out above the previous resistance level. However, the MACD indicator shows diminishing bullish momentum, while the RSI stands at 74, suggesting the potential for a technical correction as the RSI has entered overbought territory.
Resistance level: 85.45, 89.10
Support level: 83.15, 80.20

Trade with simulated capital and earn real profits after you pass our trader assessment.

20 May 2025, 06:46 Gold Slips as Ceasefire Hopes Curb Safe-Haven Demand

7 May 2025, 03:59 Geopolitical Risks and FOMC Uncertainty Shake Global Markets

6 May 2025, 05:53 Dollar Dips, Gold Rallies on U.S.-Taiwan Risk


New Registrations Unavailable
We’re not accepting new registrations at the moment.
While new sign ups are unavailable, existing users can continue their challenges and trading activities as usual.
Disclaimer: This website exclusively provides proprietary trading services. We do not engage in any regulated activities, offer investment management services, or manage funds on behalf of external clients. Our trading activities are conducted solely with the firm's own capital, and we do not accept client deposits or manage client accounts. It's important to note that none of the services we provide should be construed as investment or financial services in accordance with applicable laws.
This website offers services related to professional skill and experience assessment, which determine your eligibility to trade with the firm's capital. The outcome of these services is inherently determined by your individual skill level and ability to perform within the trading requirements and objectives outlined for each service separately. Clients are strongly advised to thoroughly understand the requirements of the services before signing up for any.
The content provided on this website is for informational purposes only and does not constitute financial, investment, or trading advice. The information presented is based on sources believed to be reliable, but we do not guarantee its accuracy, completeness, or timeliness. We disclaim any liability for any loss or damage arising directly or indirectly from the use of or reliance on the information provided on this website.
This website is not directed to residents of certain jurisdictions such as the United States, Singapore, Australia, China and some other specified regions, and is not intended for distribution to, or use by, any person in any countries or jurisdictions where such distribution or use would be contrary to local law or regulation.
This website is owned by Finzero Cap Ltd, a company incorporated in the Republic of Cyprus under registration number HE414308, with its registered office at 62 Athalassas, Mezzanine, Strovolos 2012, Nicosia, Cyprus. Finzero Cap Ltd serves as the authorized representative for PU Prime Ltd.
