Join the PU Xtrader Challenge Today
Trade with simulated capital and earn real profits after you pass our trader assessment.
Join the PU Xtrader Challenge Today
Trade with simulated capital and earn real profits after you pass our trader assessment.
27 March 2024,05:59
Daily Market AnalysisMarket Insights
27 March 2024, 05:59
* The dollar index (DXY) surged on the latest upbeat U.S. economic data.
* Japanese Yen once again comes to the 2022 Japanese authority intervention level.
* Cocoa futures contract skyrocketing, surpassing the $10,000 mark.
The dollar index (DXY) advanced yesterday on the back of encouraging economic indicators, bolstering confidence in the resilience of the U.S. economy. Of particular note, February’s Durable Goods Orders surged from a decline of 6.9% to a growth of 1.4%, signalling sustained momentum in consumption activity and potentially exacerbating inflationary pressures. This shift in economic sentiment has prompted a reassessment of market expectations regarding future Federal Reserve interest rate adjustments, contributing to a downturn in U.S. equity markets as investors await the release of the PCE index data later this week.
Concurrently, the Japanese Yen has remained subdued amidst the dollar’s resurgence, nearing levels that may prompt intervention by Japanese authorities to stabilise the currency.
Turning to commodities, cocoa futures experienced a notable rally, reaching an unprecedented high exceeding $10,000 per contract in the latest session. This surge reflects the challenges faced by the global cocoa market, grappling with its most significant supply deficit in more than sixty years. Analysts caution that the situation may worsen, underscoring the likelihood of continued upward pressure on cocoa prices as the market grapples with these unprecedented supply constraints.
Current rate hike bets on 1st May Fed interest rate decision:
Source: CME Fedwatch Tool
0 bps (90%) VS -25 bps (10%)
(MT4 System Time)

Source: MQL5
(MT4 System Time)

Source: MQL5

The Dollar Index, which tracks against a basket of major currencies, remained strong amidst a cautious sentiment among investors. With anticipation building for the release of the PCE Price Index data scheduled for Good Friday, crucial for assessing inflation, market movement is expected to be subdued. Despite the holiday, top Federal Reserve officials, including Chair Jerome Powell and Mary Daly, are scheduled to provide insights, potentially setting the stage for market shifts. Traders are advised to stay vigilant and strategize as economic data released over the weekend could lead to heightened volatility on Monday.
Currently, the Dollar Index is trading higher and testing the resistance level. The MACD indicator shows diminishing bearish momentum, while the RSI stands at 63, suggesting the potential for further gains as the RSI remains above the midline
Resistance level: 104.45, 104.95
Support level:104.00, 103.65
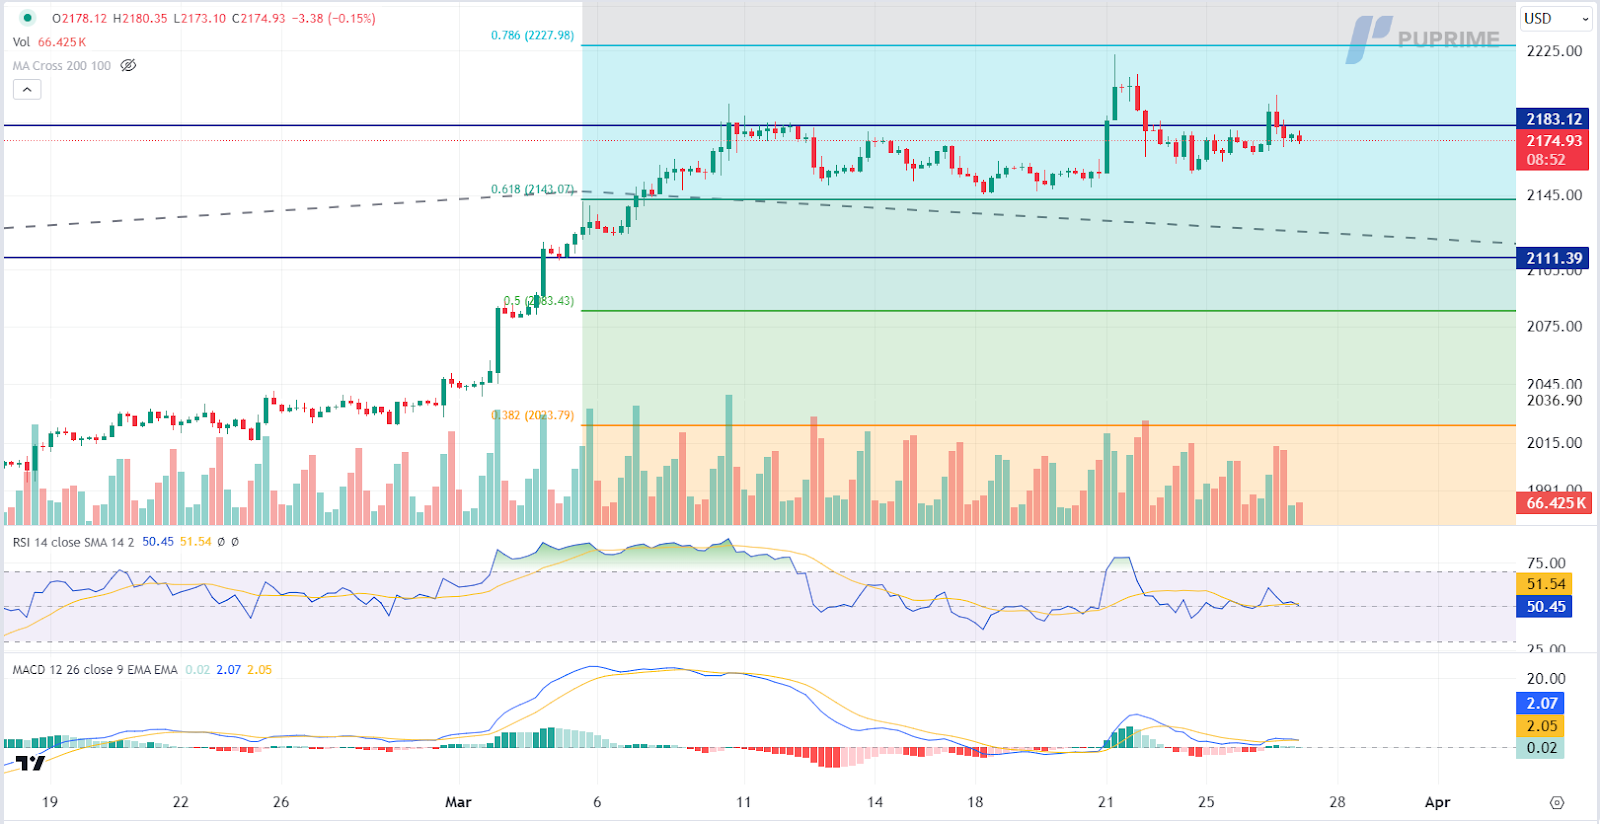
Gold prices experienced a modest rebound, finding support near key resistance levels amid lacklustre economic data from the US. The Conference Board’s consumer confidence index fell below expectations, indicating ongoing concerns about economic activity. With volatility looming due to major events and data releases on the horizon, gold’s safe-haven appeal is expected to remain strong, potentially supporting prices in the coming days.
Currently, gold prices are trading higher and testing the resistance level. However, the MACD indicator shows diminishing bullish momentum, while the RSI stands at 50, suggesting the possibility of a technical correction as the RSI retreated sharply from overbought territory
Resistance level: 2185.00, 2230.00
Support level: 2145.00, 2110.00
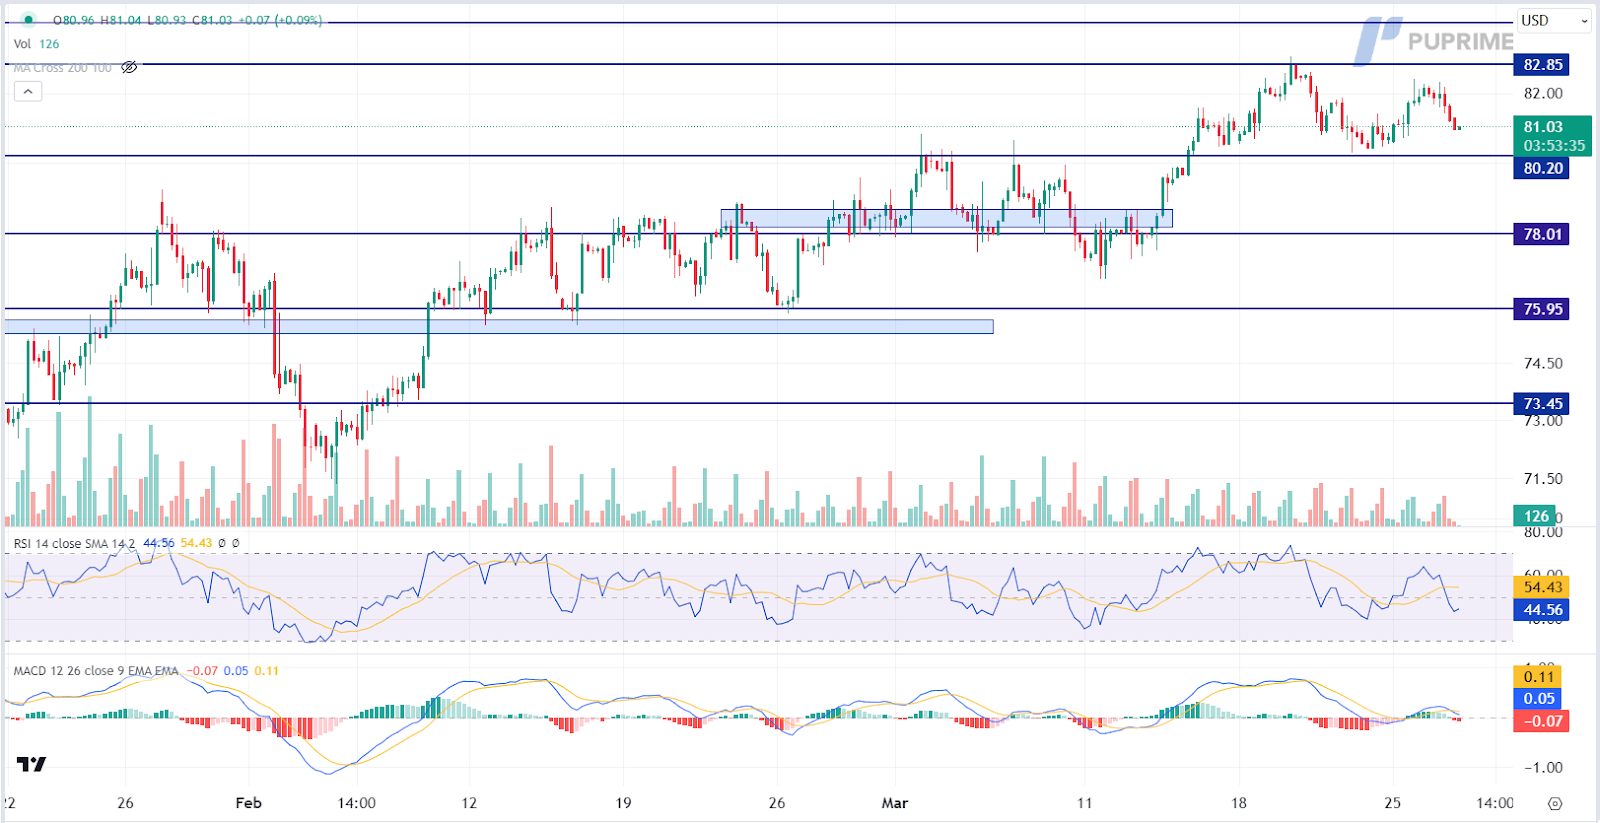
Crude oil prices retreated from significant resistance levels as market sentiment remained cautious ahead of key events. Investors opted to reduce exposure to high-risk commodities amid ongoing uncertainties. However, losses were mitigated by concerns over potential supply disruptions, particularly after Russia’s directive to companies to reduce output in line with OPEC+ commitments. With US crude inventories experiencing a notable increase, attention now turns to the upcoming EIA Oil Inventories release and broader economic performance for important trading signals.
Currently, oil prices are trading lower after retracing from the resistance level. The MACD indicator shows increasing bearish momentum, while the RSI stands at 43, suggesting the possibility of further losses towards the support level as the RSI remains below the midline.
Resistance level: 82.85, 84.10
Support level: 80.20, 78.00

Trade with simulated capital and earn real profits after you pass our trader assessment.

20 May 2025, 06:46 Gold Slips as Ceasefire Hopes Curb Safe-Haven Demand

7 May 2025, 03:59 Geopolitical Risks and FOMC Uncertainty Shake Global Markets

6 May 2025, 05:53 Dollar Dips, Gold Rallies on U.S.-Taiwan Risk


New Registrations Unavailable
We’re not accepting new registrations at the moment.
While new sign ups are unavailable, existing users can continue their challenges and trading activities as usual.
Disclaimer: This website exclusively provides proprietary trading services. We do not engage in any regulated activities, offer investment management services, or manage funds on behalf of external clients. Our trading activities are conducted solely with the firm's own capital, and we do not accept client deposits or manage client accounts. It's important to note that none of the services we provide should be construed as investment or financial services in accordance with applicable laws.
This website offers services related to professional skill and experience assessment, which determine your eligibility to trade with the firm's capital. The outcome of these services is inherently determined by your individual skill level and ability to perform within the trading requirements and objectives outlined for each service separately. Clients are strongly advised to thoroughly understand the requirements of the services before signing up for any.
The content provided on this website is for informational purposes only and does not constitute financial, investment, or trading advice. The information presented is based on sources believed to be reliable, but we do not guarantee its accuracy, completeness, or timeliness. We disclaim any liability for any loss or damage arising directly or indirectly from the use of or reliance on the information provided on this website.
This website is not directed to residents of certain jurisdictions such as the United States, Singapore, Australia, China and some other specified regions, and is not intended for distribution to, or use by, any person in any countries or jurisdictions where such distribution or use would be contrary to local law or regulation.
This website is owned by Finzero Cap Ltd, a company incorporated in the Republic of Cyprus under registration number HE414308, with its registered office at 62 Athalassas, Mezzanine, Strovolos 2012, Nicosia, Cyprus. Finzero Cap Ltd serves as the authorized representative for PU Prime Ltd.
