Join the PU Xtrader Challenge Today
Trade with simulated capital and earn real profits after you pass our trader assessment.
Join the PU Xtrader Challenge Today
Trade with simulated capital and earn real profits after you pass our trader assessment.
13 March 2024,05:36
Daily Market AnalysisMarket Insights
13 March 2024, 05:36
* The U.S. CPI came higher than the market consensus, remaining above 3%, suggesting that the Fed may be extra cautious in amending its monetary policy.
* Japan is optimistic about maintaining a healthy wage growth, fueling optimism about BoJ’s March rate hike.
*U.S. equity markets edge higher despite strong CPI led by large tech counters, namely Oracle and Nvidia.
The latest U.S. Consumer Price Index (CPI) data, revealing a year-over-year increase of 3.2%, has introduced a notable paradigm shift in market sentiment. This data hints at a potentially more cautious approach by the Federal Reserve regarding interest rate cuts, signalling the likelihood of an extended period of economic pressure that might defer the expected easing of monetary policy. Curiously, despite concerns about inflation and the possibility of the Fed maintaining high-interest rates at its upcoming meeting, U.S. equity markets responded positively, closing higher and instilling renewed confidence among investors.
In contrast, gold, often considered a hedge against inflation and currency devaluation, relinquished its bullish stance, witnessing a decline of more than 1% in the last session. This retracement can be attributed to the post-CPI strengthening of the dollar. Meanwhile, oil prices remained below the $78 threshold, underscoring a cautious stance in the commodities market influenced by fluctuating demand forecasts and persistent geopolitical uncertainties.
In Japan, Toyota Motor’s expressed willingness to fully meet wage hike demands has sparked speculation about a potential shift in the Bank of Japan’s (BoJ) policy stance. The proactive response of Japan’s largest automaker to increased labour costs implies broader economic confidence and hints at inflationary pressures. This dynamic has the potential to prompt the BoJ to reconsider its longstanding accommodative monetary policy.
Current rate hike bets on 20th March Fed interest rate decision:
Source: CME Fedwatch Tool
0 bps (95%) VS -25 bps (5%)
(MT4 System Time)

Source: MQL5
(MT4 System Time)

Source: MQL5

The Dollar Index surged post-release of strong US inflation data, indicating persistent inflationary pressures that may complicate Federal Reserve rate decisions. February’s consumer price growth exceeded expectations, with headline US consumer prices rising by 3.2% annually, surpassing forecasts of 3.1%. Similarly, core CPI data climbed to 3.8%, exceeding economists’ projections at 3.7%, as per the US Bureau of Labor Statistics.
Currently, the Dollar Index is trading higher, testing resistance levels. MACD shows increasing bullish momentum, while RSI at 45 suggests potential for extended gains post-breakout, as it rebounded sharply from oversold territory.
Resistance levels: 102.90, 103.70
Support levels: 102.10, 101.35
Gold prices experienced a notable decline amidst an optimistic US inflation report and rising US Treasury yields, as investors responded to concerns about potential hikes in interest rates. This prompted a shift away from non-yield assets like gold. Meanwhile, slight increases were observed in yields on the 2-year and 10-year Treasury bonds. Investors are advised to closely monitor forthcoming US economic data releases and statements from the Federal Reserve for further insights and potential trading signals.
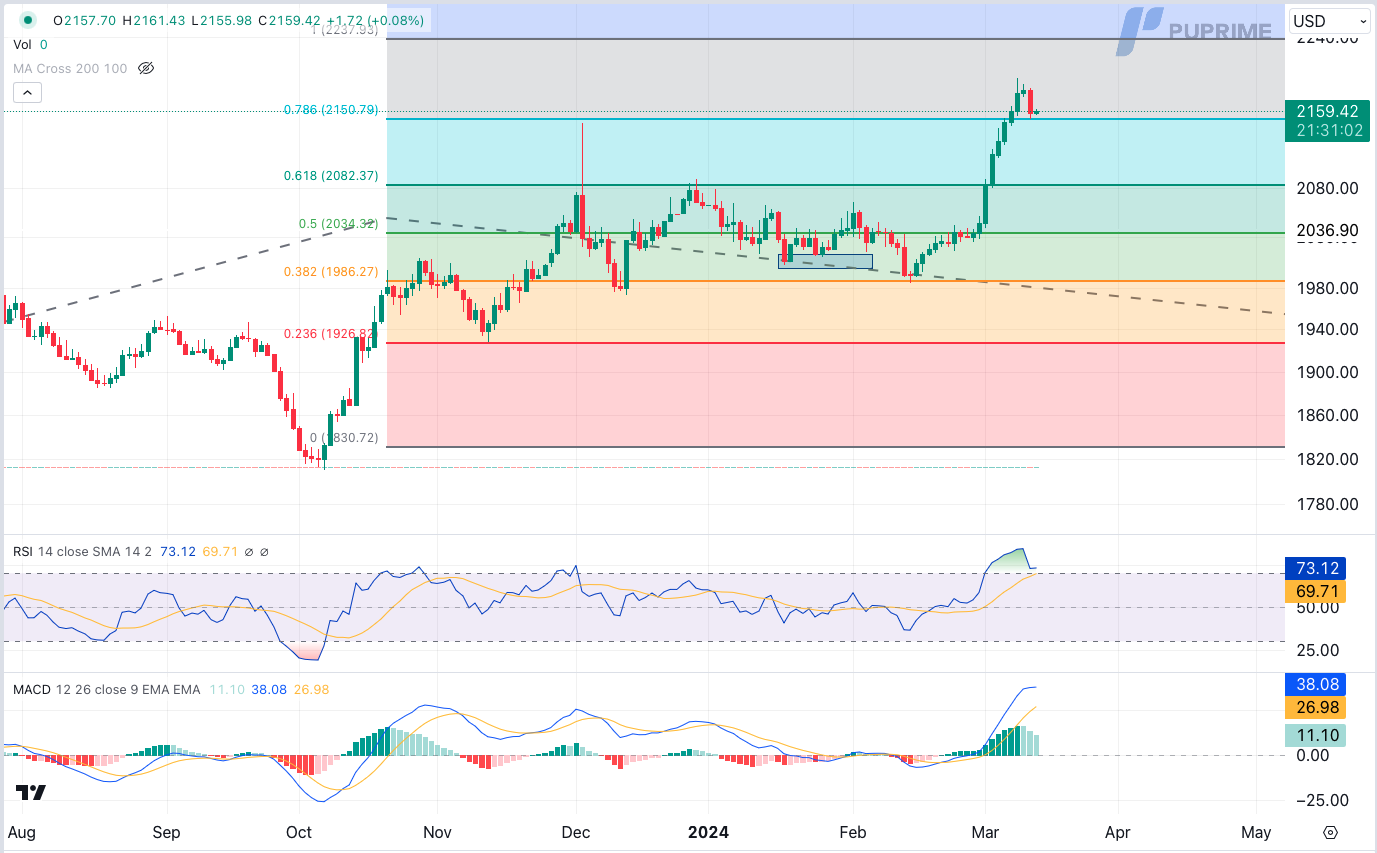
Currently, gold prices are trading lower, testing the support level. The Moving Average Convergence Divergence (MACD) indicates a decrease in bullish momentum, while the Relative Strength Index (RSI) stands at 73, suggesting a possibility of the commodity entering overbought territory.
Resistance levels: 2235.00, 2350.00
Support levels: 2150.00, 2080.00
Oil prices have demonstrated a degree of stability amidst mixed market sentiment. The US Energy Information Administration (EIA) recently raised its 2024 domestic oil output growth forecast, potentially indicating an uptick in supply levels. Conversely, OPEC maintained its optimistic forecast for robust global oil demand growth in 2024 and 2025, alongside an upward revision in economic growth projections.
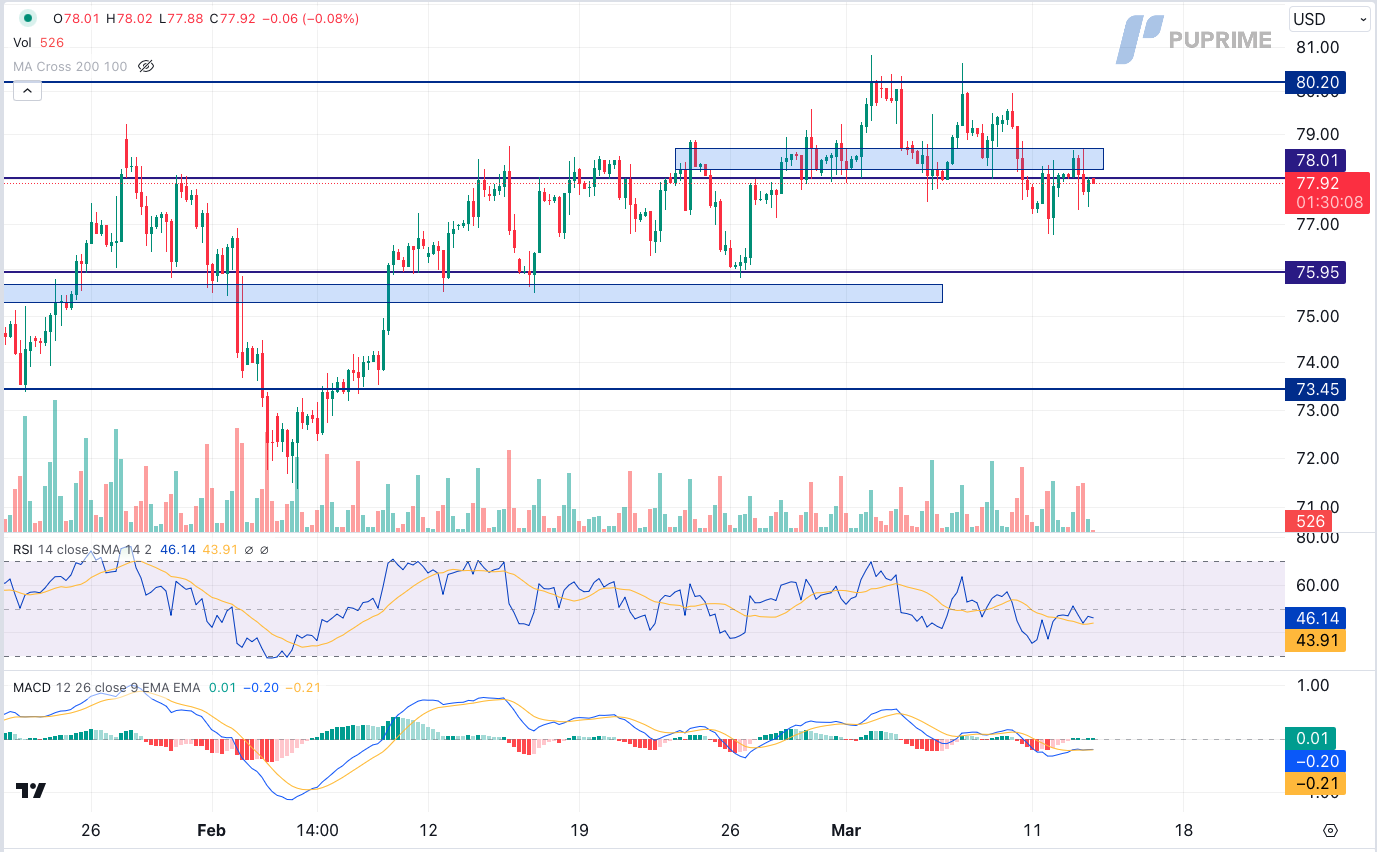
Currently, oil prices are holding steady as they approach a significant resistance level. However, both the Moving Average Convergence Divergence (MACD) and Relative Strength Index (RSI) indicators are hovering near the midline, suggesting a lack of significant catalysts for a breakout.
Resistance level: 78.00, 80.20
Support level: 75.95, 73.45

Trade with simulated capital and earn real profits after you pass our trader assessment.

20 May 2025, 06:46 Gold Slips as Ceasefire Hopes Curb Safe-Haven Demand

7 May 2025, 03:59 Geopolitical Risks and FOMC Uncertainty Shake Global Markets

6 May 2025, 05:53 Dollar Dips, Gold Rallies on U.S.-Taiwan Risk


New Registrations Unavailable
We’re not accepting new registrations at the moment.
While new sign ups are unavailable, existing users can continue their challenges and trading activities as usual.
Disclaimer: This website exclusively provides proprietary trading services. We do not engage in any regulated activities, offer investment management services, or manage funds on behalf of external clients. Our trading activities are conducted solely with the firm's own capital, and we do not accept client deposits or manage client accounts. It's important to note that none of the services we provide should be construed as investment or financial services in accordance with applicable laws.
This website offers services related to professional skill and experience assessment, which determine your eligibility to trade with the firm's capital. The outcome of these services is inherently determined by your individual skill level and ability to perform within the trading requirements and objectives outlined for each service separately. Clients are strongly advised to thoroughly understand the requirements of the services before signing up for any.
The content provided on this website is for informational purposes only and does not constitute financial, investment, or trading advice. The information presented is based on sources believed to be reliable, but we do not guarantee its accuracy, completeness, or timeliness. We disclaim any liability for any loss or damage arising directly or indirectly from the use of or reliance on the information provided on this website.
This website is not directed to residents of certain jurisdictions such as the United States, Singapore, Australia, China and some other specified regions, and is not intended for distribution to, or use by, any person in any countries or jurisdictions where such distribution or use would be contrary to local law or regulation.
This website is owned by Finzero Cap Ltd, a company incorporated in the Republic of Cyprus under registration number HE414308, with its registered office at 62 Athalassas, Mezzanine, Strovolos 2012, Nicosia, Cyprus. Finzero Cap Ltd serves as the authorized representative for PU Prime Ltd.
