Join the PU Xtrader Challenge Today
Trade with simulated capital and earn real profits after you pass our trader assessment.
Join the PU Xtrader Challenge Today
Trade with simulated capital and earn real profits after you pass our trader assessment.
12 March 2024,05:45
Daily Market AnalysisMarket Insights
12 March 2024, 05:45
* Gold Prices are sideways at near $2185 levels ahead of the U.S. CPI reading today.
* Japanese 10-year bond yield has climbed to the highest level in 2024, anticipating the first BoJ rate hike in decades.
*BTC surge passes $72000 mark while bullish momentum remains intact.
The U.S. financial markets are in a state of poised observation as they await the imminent release of the Consumer Price Index (CPI) data later today. This crucial piece of inflationary data is poised to significantly influence market conjecture regarding the Federal Reserve’s potential timeline for adjustments in its monetary policy framework. This speculative environment is further compounded by anticipations surrounding the Bank of Japan (BoJ), with widespread expectations of an impending rate hike—the first of its kind in several decades. This anticipation has propelled Japan’s 10-year bond yield to its peak level in three months, simultaneously strengthening the Japanese Yen in its performance against the dollar.
Stability marks the tone in the oil sector, with prices hovering around the $78 benchmark. Stakeholders in the oil market are keenly awaiting the U.S. CPI figures and the forthcoming monthly discourse from OPEC+. The insights derived from these reports are anticipated to shed light on the evolving dynamics of demand and supply within the crude oil landscape.
In contrast, the cryptocurrency domain, led by Bitcoin (BTC), showcases a vibrant uptick, breaching the $72,000 threshold for the first time. This rally underscores the crypto market’s growing divergence from conventional financial markets, buoyed by substantial capital inflows through BTC exchange-traded funds (ETFs). A notable shift in the market dynamics is attributed to the London Stock Exchange’s recent policy to entertain applications for BTC and ETH ETFs, coupled with Thailand’s securities regulator green-lighting retail investor participation in overseas crypto ETFs.
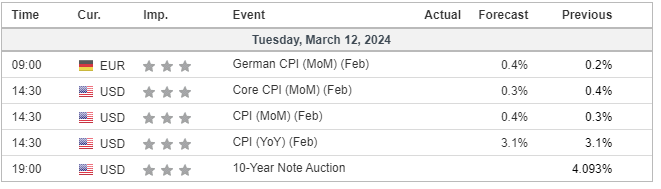
Current rate hike bets on 20th March Fed interest rate decision:
Source: CME Fedwatch Tool
0 bps (95%) VS -25 bps (5%)
(MT4 System Time)

Source: MQL5
(MT4 System Time)
Source: MQL5
The Dollar Index, tracking against a basket of major currencies, exhibited a stable performance with limited market catalysts from the US. Investors’ attention is now laser-focused on the upcoming release of the Consumer Price Index (CPI) data for February. This critical inflation report takes centre stage, carrying substantial weight on the Federal Reserve’s prospective interest rate decisions in 2024, as emphasised by Chair Jerome Powell and other key officials in recent statements.
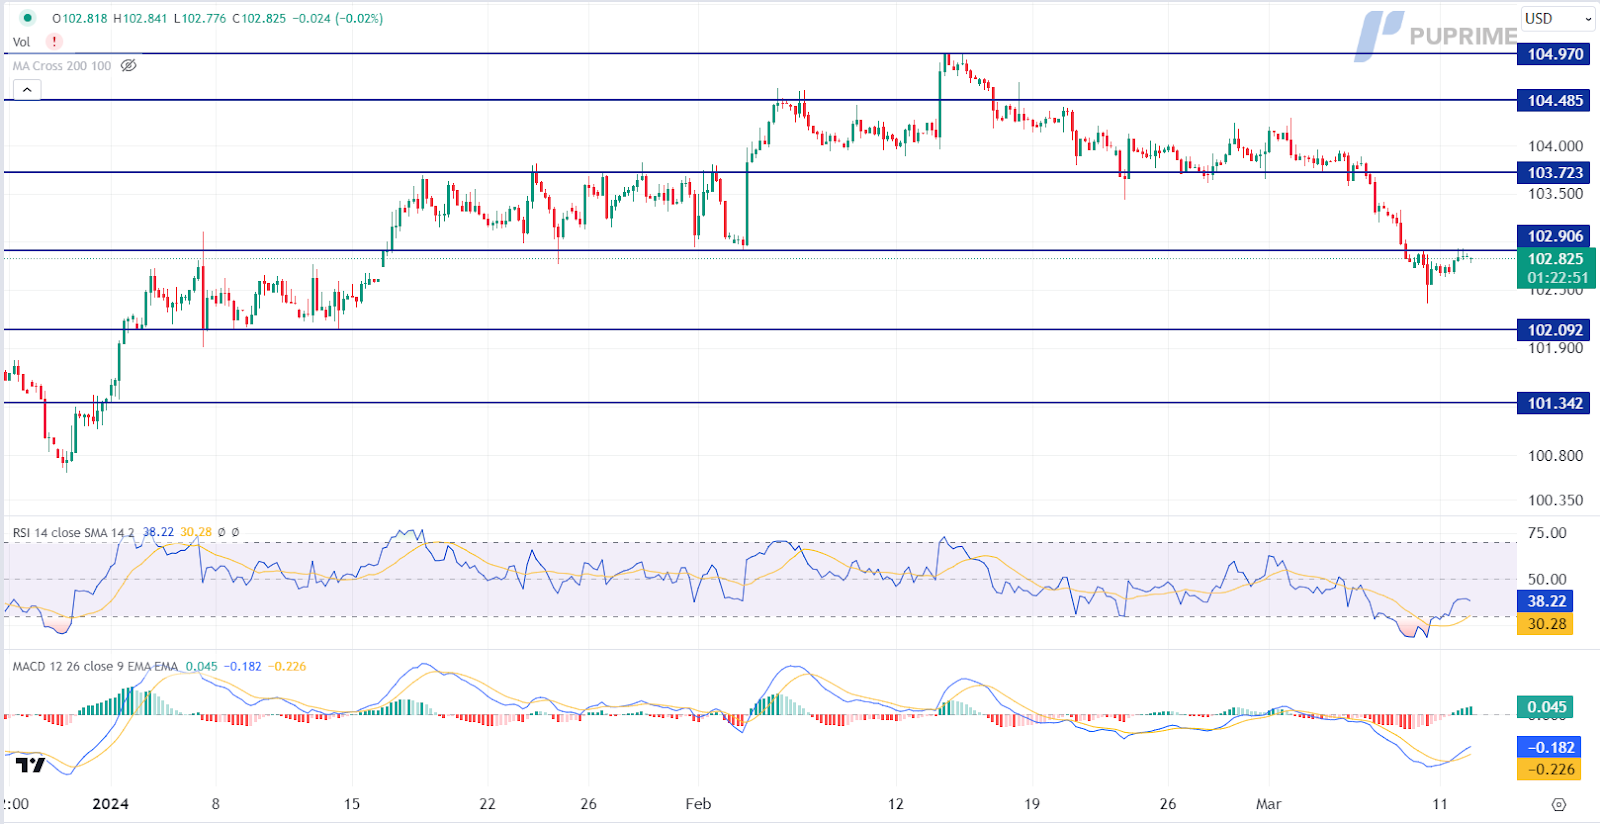
The Dollar Index is trading flat, while currently testing the resistance level. The Moving Average Convergence Divergence (MACD) has illustrated increasing bullish momentum, while the Relative Strength Index (RSI) is at 38, suggesting the index might extend its gains after the breakout since the RSI rebounded sharply from oversold territory.
Resistance levels: 102.90, 103.70
Support levels: 102.10, 101.35
In a day marked by subdued market activity, the gold market exhibited resilience, maintaining a predominantly bullish outlook. The precious metal’s positive trajectory is underpinned by concerns surrounding lackluster economic performance in the US and escalating tensions in the Middle East. With recent economic data falling below expectations, driving Treasury yields lower, gold continues to shine as a safe-haven asset, drawing investors seeking stability.
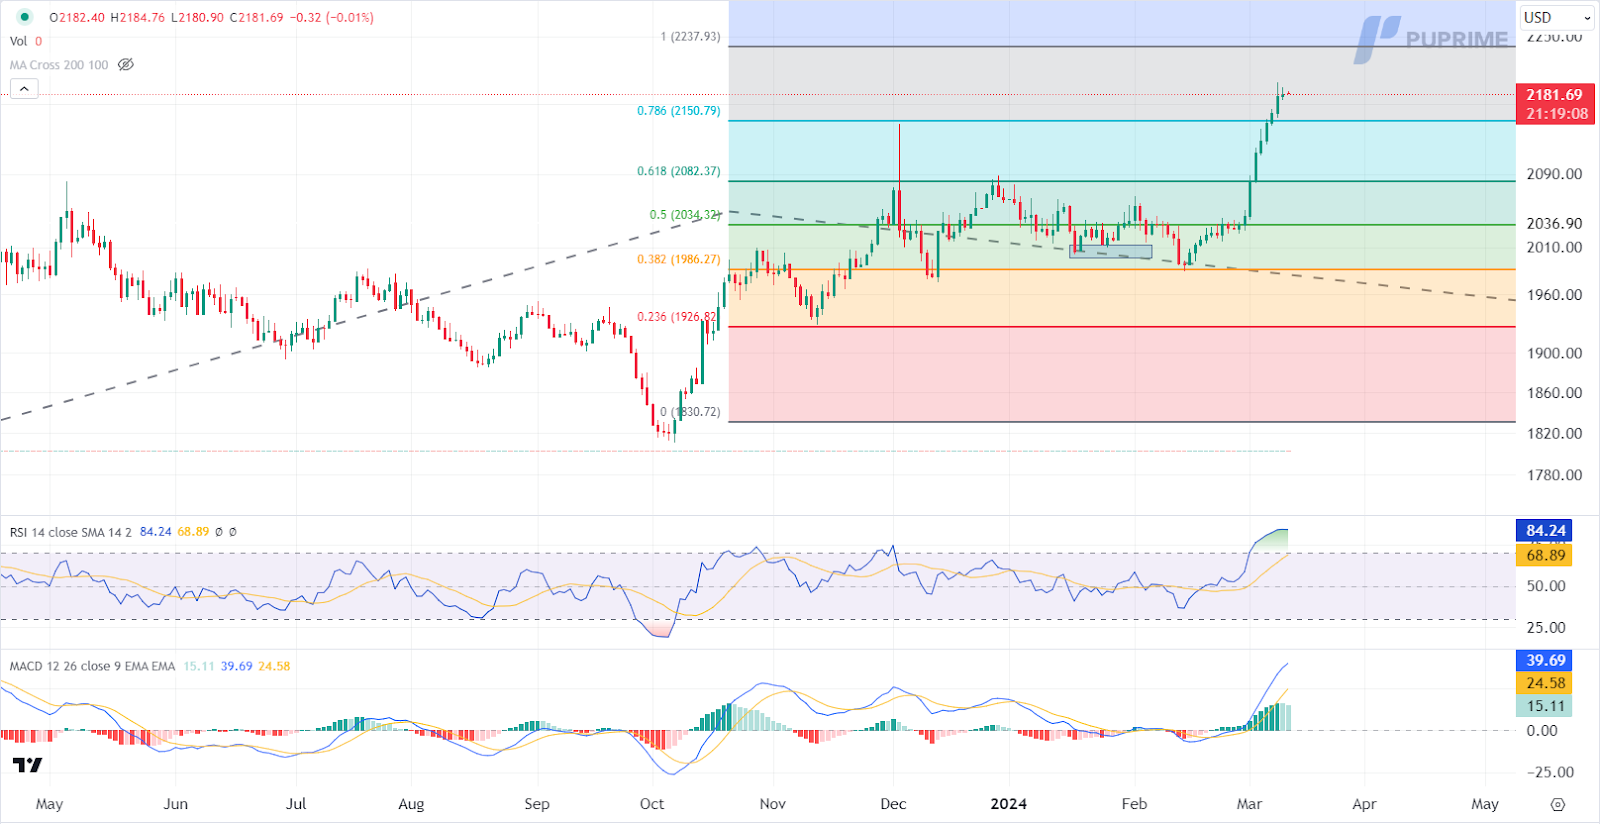
Gold prices are trading higher following the prior breakout above the previous resistance level. However, the Moving Average Convergence Divergence (MACD) has illustrated diminishing bullish momentum, while the Relative Strength Index (RSI) is at 84, suggesting the commodity might enter overbought territory.
Resistance levels: 2235.00, 2350.00
Support levels: 2150.00, 2080.00
Crude oil prices experienced a decline as investors opted for a selloff strategy to navigate potential market volatilities. Attention is now turned towards the release of monthly reports from OPEC and the International Energy Agency later in the week. These reports promise an updated perspective on the global crude demand and supply dynamics. Concurrently, a crucial US Consumer Price Index (CPI) inflation report looms large, offering additional cues on the future direction of interest rates.
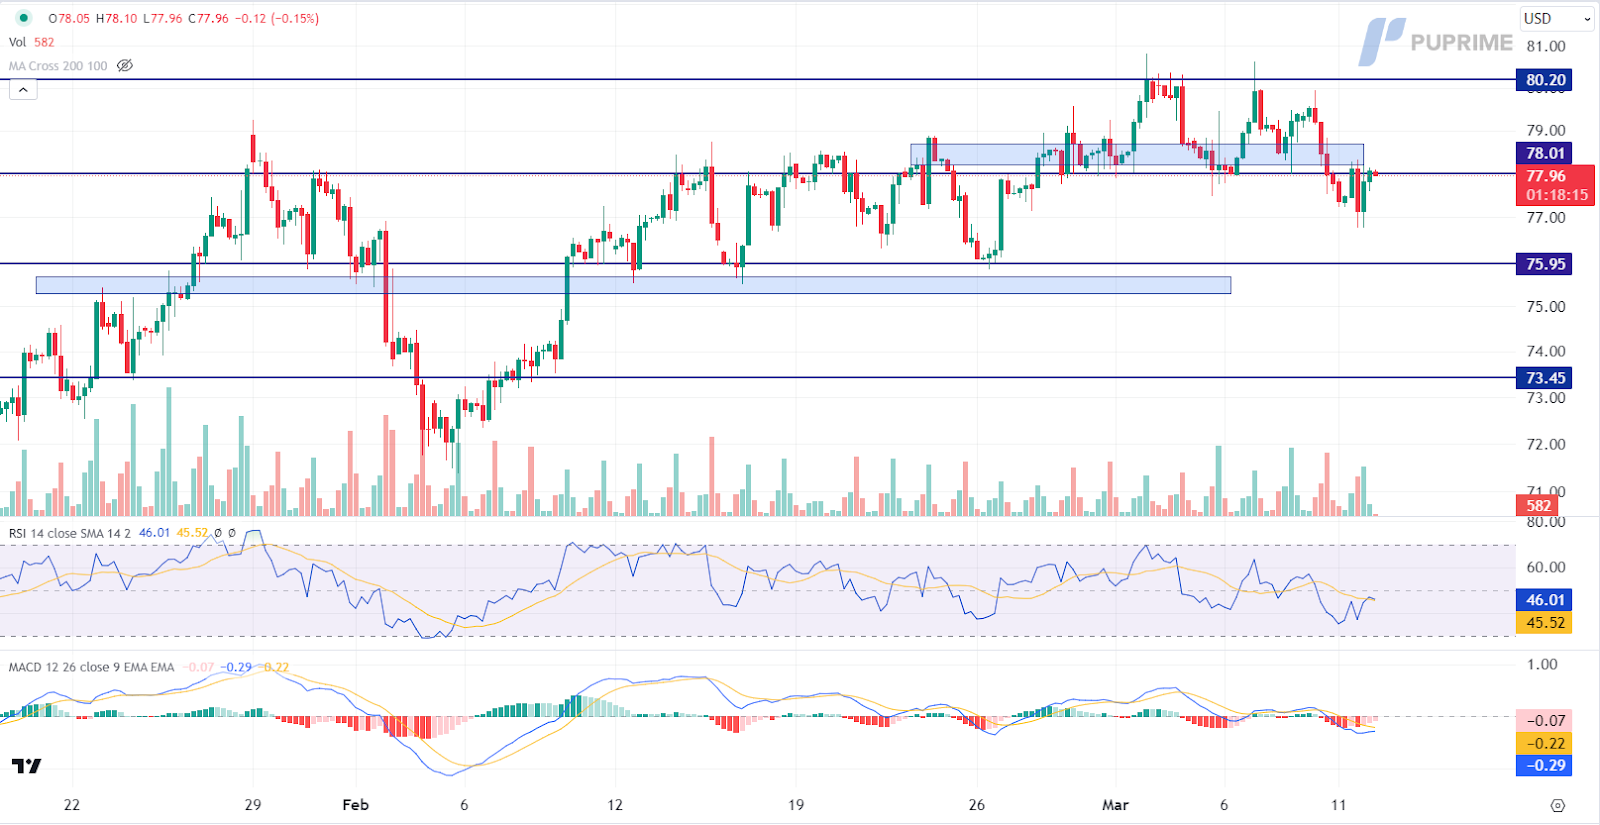
Oil prices are trading lower following the prior breakout below the previous support level. However, the Moving Average Convergence Divergence (MACD) has illustrated diminishing bearish momentum, while the Relative Strength Index (RSI) is at 46, suggesting the commodity might experience technical correction since the RSI rebounded sharply from oversold territory.
Resistance levels: 78.00, 80.20
Support levels: 75.95, 73.45

Trade with simulated capital and earn real profits after you pass our trader assessment.

20 May 2025, 06:46 Gold Slips as Ceasefire Hopes Curb Safe-Haven Demand

7 May 2025, 03:59 Geopolitical Risks and FOMC Uncertainty Shake Global Markets

6 May 2025, 05:53 Dollar Dips, Gold Rallies on U.S.-Taiwan Risk


New Registrations Unavailable
We’re not accepting new registrations at the moment.
While new sign ups are unavailable, existing users can continue their challenges and trading activities as usual.
Disclaimer: This website exclusively provides proprietary trading services. We do not engage in any regulated activities, offer investment management services, or manage funds on behalf of external clients. Our trading activities are conducted solely with the firm's own capital, and we do not accept client deposits or manage client accounts. It's important to note that none of the services we provide should be construed as investment or financial services in accordance with applicable laws.
This website offers services related to professional skill and experience assessment, which determine your eligibility to trade with the firm's capital. The outcome of these services is inherently determined by your individual skill level and ability to perform within the trading requirements and objectives outlined for each service separately. Clients are strongly advised to thoroughly understand the requirements of the services before signing up for any.
The content provided on this website is for informational purposes only and does not constitute financial, investment, or trading advice. The information presented is based on sources believed to be reliable, but we do not guarantee its accuracy, completeness, or timeliness. We disclaim any liability for any loss or damage arising directly or indirectly from the use of or reliance on the information provided on this website.
This website is not directed to residents of certain jurisdictions such as the United States, Singapore, Australia, China and some other specified regions, and is not intended for distribution to, or use by, any person in any countries or jurisdictions where such distribution or use would be contrary to local law or regulation.
This website is owned by Finzero Cap Ltd, a company incorporated in the Republic of Cyprus under registration number HE414308, with its registered office at 62 Athalassas, Mezzanine, Strovolos 2012, Nicosia, Cyprus. Finzero Cap Ltd serves as the authorized representative for PU Prime Ltd.
