Join the PU Xtrader Challenge Today
Trade with simulated capital and earn real profits after you pass our trader assessment.
Join the PU Xtrader Challenge Today
Trade with simulated capital and earn real profits after you pass our trader assessment.
15 March 2024,06:18
Daily Market AnalysisMarket Insights
15 March 2024, 06:18
* Dollar Index Surges on Inflation Data, Treasury Yields Rebound
* Crude Oil Prices Extend Gains on Supply Deficit Projection
* Gold Prices Consolidate Amid Profit-Taking, Fed Rate Expectations
Amidst a flurry of economic data releases and speculation, the Dollar Index surged, propelled by stronger-than-expected inflation figures. The robust data fueled expectations of imminent interest rate hikes, subsequently bolstering US Treasury yields. In parallel, crude oil prices sustained their upward trajectory, supported by the International Energy Agency’s forecast of a supply deficit for 2024. This projection, driven by improved economic performance and growing global demand, underpinned the continued momentum in oil markets.
In contrast, gold prices experienced losses and underwent consolidation near support levels. This downturn was attributed to profit-taking strategies among investors awaiting further market catalysts. Concurrently, US equity markets faced retreats amid surging bond yields, driven by mounting concerns over inflation. The shifting focus to the Japanese yen garnered attention, with speculation swirling around potential policy shifts by the Bank of Japan. Anticipation grew for a potential rate hike in April, adding an additional layer of complexity to global financial markets.
Current rate hike bets on 20th March Fed interest rate decision:
Source: CME Fedwatch Tool
0 bps (95%) VS -25 bps (5%)
(MT4 System Time)

Source: MQL5
(MT4 System Time)
N/A
Source: MQL5
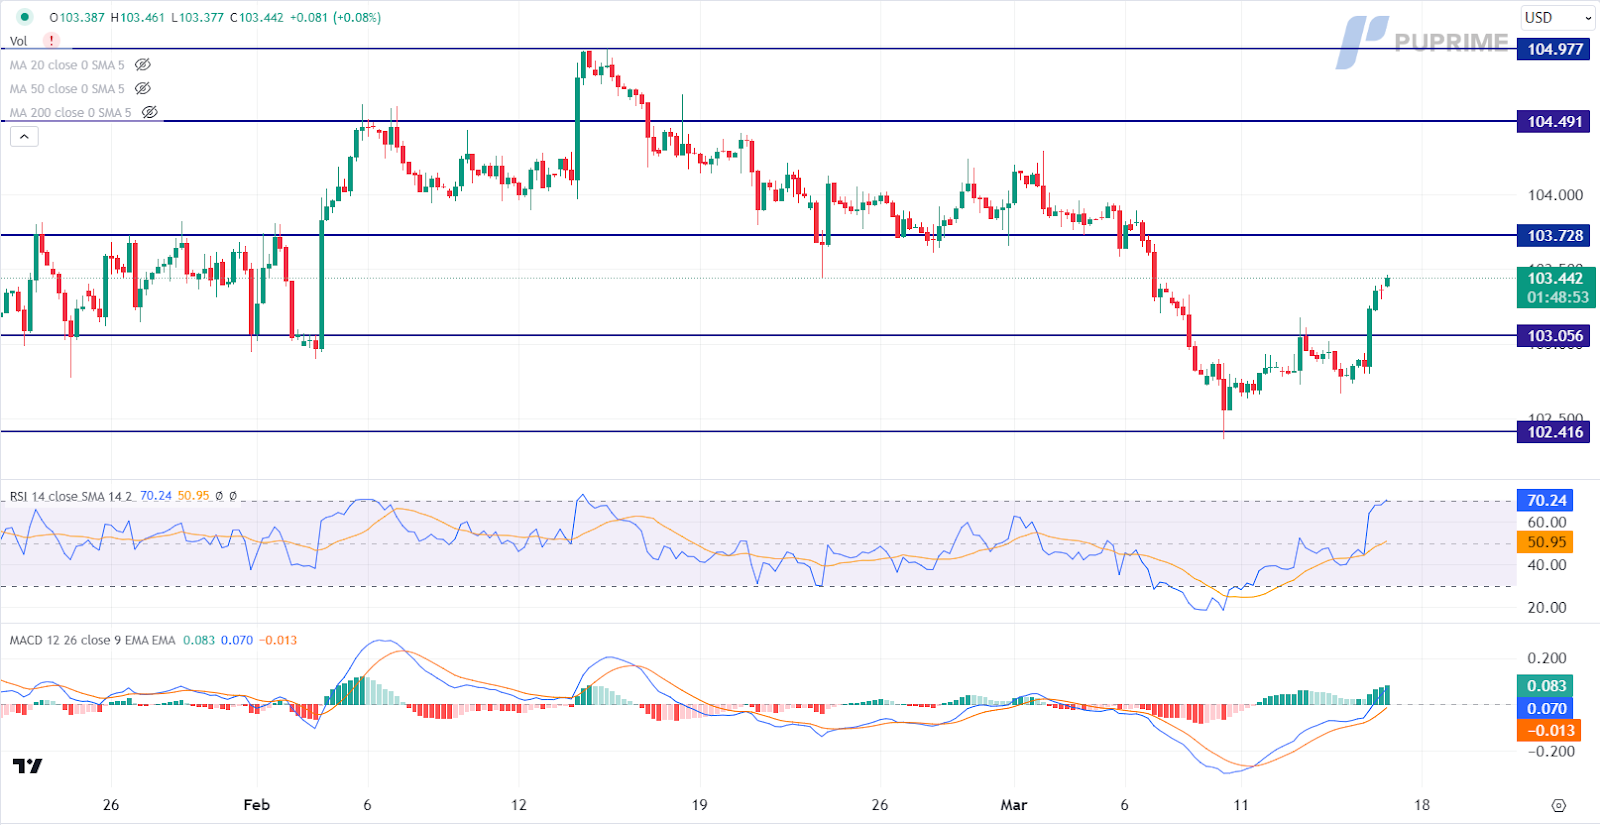
The Dollar Index, which gauges the performance of the US dollar against a basket of major currencies, saw a notable rebound driven by upbeat inflation data. According to recent data from the US Bureau of Labor Statistics, the Producer Price Index (PPI) for the previous month witnessed a significant uptick from 0.30% to 0.60%, surpassing market projections. Additionally, the Department of Labor’s report on Initial Jobless Claims revealed a figure of 209K, outperforming the anticipated 218K, indicating ongoing strength in the labor market.
The Dollar Index has shown an upward trend since breaking above the previous resistance level. The Moving Average Convergence Divergence (MACD) indicator has depicted increasing bullish momentum. However, the Relative Strength Index (RSI) currently stands at 70, suggesting a potential entry into overbought territory.
Resistance level: 103.75, 104.50
Support level:103.05, 102.40
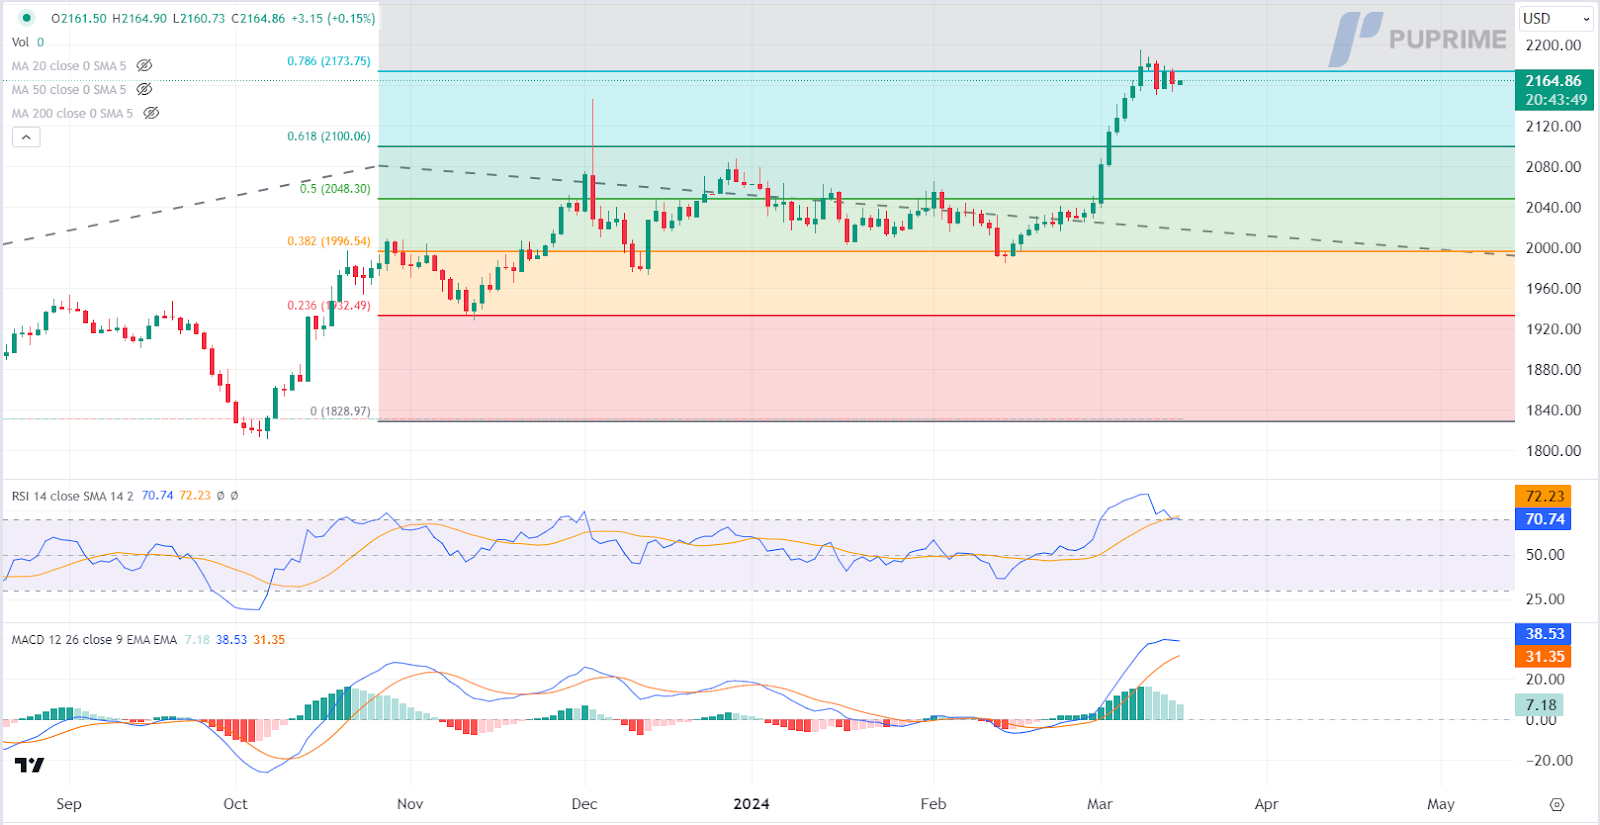
Gold prices have encountered a setback, retracing from their recent record highs as investors engaged in profit-taking maneuvers and awaited further market catalysts. The decision to book profits comes amidst improved inflation data, which has heightened expectations for the Federal Reserve to postpone any potential rate cut policies. This anticipation, in turn, could impact non-yielding commodities like gold, prompting investors to reassess their positions.
Currently, gold prices are trading lower following the retracement from the resistance level. The Moving Average Convergence Divergence (MACD) indicator indicates diminishing bullish momentum, suggesting a potential shift in sentiment. Meanwhile, the Relative Strength Index (RSI) stands at 71, indicating a possibility of entering overbought territory.
Resistance level: 2175.00, 2265.00
Support level: 2100.00, 2050.00
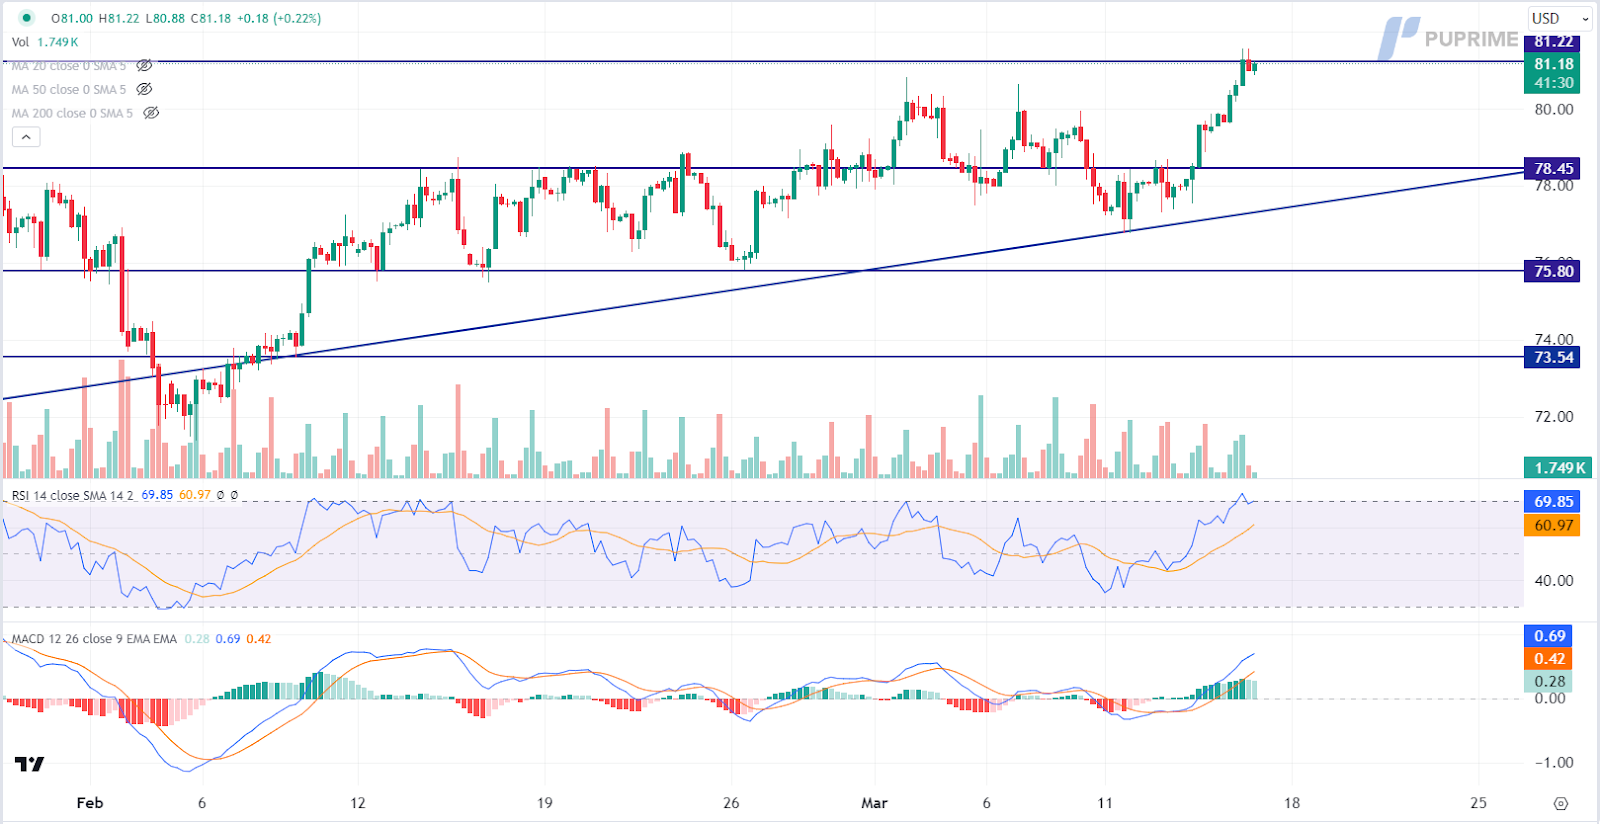
Crude oil prices have maintained their upward momentum, buoyed by bullish forecasts from the International Energy Agency (IEA) projecting a supply deficit for the year 2024. The IEA’s outlook highlights factors such as improved economic performance, particularly in the United States, and increased bunkering activity, contributing to a stronger-than-expected rise in global oil demand. Additionally, expectations of a decline in world oil production due to weather-related shut-ins and ongoing OPEC+ curbs further bolstered market sentiment.
Currently, oil prices are trading higher as they test the resistance level. However, there are indications of diminishing bullish momentum, as reflected by the Moving Average Convergence Divergence (MACD) indicator. Furthermore, the Relative Strength Index (RSI) stands at 70, signalling that the commodity may be entering overbought territory, potentially prompting a technical correction in the near term.
Resistance level: 81.20, 85.45
Support level: 78.45, 75.80

Trade with simulated capital and earn real profits after you pass our trader assessment.

20 May 2025, 06:46 Gold Slips as Ceasefire Hopes Curb Safe-Haven Demand

7 May 2025, 03:59 Geopolitical Risks and FOMC Uncertainty Shake Global Markets

6 May 2025, 05:53 Dollar Dips, Gold Rallies on U.S.-Taiwan Risk


New Registrations Unavailable
We’re not accepting new registrations at the moment.
While new sign ups are unavailable, existing users can continue their challenges and trading activities as usual.
Disclaimer: This website exclusively provides proprietary trading services. We do not engage in any regulated activities, offer investment management services, or manage funds on behalf of external clients. Our trading activities are conducted solely with the firm's own capital, and we do not accept client deposits or manage client accounts. It's important to note that none of the services we provide should be construed as investment or financial services in accordance with applicable laws.
This website offers services related to professional skill and experience assessment, which determine your eligibility to trade with the firm's capital. The outcome of these services is inherently determined by your individual skill level and ability to perform within the trading requirements and objectives outlined for each service separately. Clients are strongly advised to thoroughly understand the requirements of the services before signing up for any.
The content provided on this website is for informational purposes only and does not constitute financial, investment, or trading advice. The information presented is based on sources believed to be reliable, but we do not guarantee its accuracy, completeness, or timeliness. We disclaim any liability for any loss or damage arising directly or indirectly from the use of or reliance on the information provided on this website.
This website is not directed to residents of certain jurisdictions such as the United States, Singapore, Australia, China and some other specified regions, and is not intended for distribution to, or use by, any person in any countries or jurisdictions where such distribution or use would be contrary to local law or regulation.
This website is owned by Finzero Cap Ltd, a company incorporated in the Republic of Cyprus under registration number HE414308, with its registered office at 62 Athalassas, Mezzanine, Strovolos 2012, Nicosia, Cyprus. Finzero Cap Ltd serves as the authorized representative for PU Prime Ltd.
