Join the PU Xtrader Challenge Today
Trade with simulated capital and earn real profits after you pass our trader assessment.
Join the PU Xtrader Challenge Today
Trade with simulated capital and earn real profits after you pass our trader assessment.
29 February 2024,05:49
Daily Market AnalysisMarket Insights
29 February 2024, 05:49
* U.S. GDP came short, putting pressure on the dollar’s Strength.
*The market is waiting for today’s PCE reading to gauge the dollar’s strength.
*BTC is on the way to reach its all-time high.
The Dollar Index experienced significant fluctuations, oscillating within a 0.3% range in the latest session amid diverse economic indicators from the United States. The U.S. GDP growth for the last quarter was reported at 3.2%, missing the anticipated market forecasts. Conversely, the GDP price index was recorded at 1.7%, highlighting ongoing inflationary pressures within the economy. Meanwhile, U.S. equity markets are navigating through a period of uncertainty following a rally propelled by advancements in Artificial Intelligence (AI) technology last week. The market’s focus now shifts towards the forthcoming U.S. Personal Consumption Expenditures (PCE) data, expected later today, which could have a notable impact on equity market dynamics.
In the commodities sector, gold prices are maintaining a steady course, hovering just below the significant resistance level of $2040, indicating a phase of consolidation. On the other hand, oil prices encountered a decline, pressured by unexpectedly high U.S. crude stockpile figures that have sparked concerns over the demand outlook within the United States. In the cryptocurrency arena, Bitcoin (BTC) reached a new high, exceeding $64,000, before experiencing a pullback. Despite this correction, Bitcoin maintains a position above $60,000, underlining the volatile and dynamic nature of the cryptocurrency markets.
Current rate hike bets on 20th March Fed interest rate decision:
Source: CME Fedwatch Tool
0 bps (92%) VS -25 bps (8%)
(MT4 System Time)

Source: MQL5

The Dollar Index shows a modest retreat against major currencies, influenced by disappointing US Gross Domestic Product (GDP) data, revealing a decrease from 4.90% to 3.2%. Despite this, the Federal Reserve’s hawkish stance, as communicated by New York Fed President John Williams and Atlanta Fed President Raphael Bostic, indicates a commitment to maintaining a higher interest rate environment. This mixed signal leads to the Greenback continuing its consolidation. The market is eagerly anticipating the upcoming PCE Price Index data for additional insights into inflation and interest rate trajectories.
Currently, the Dollar Index is trading lower and testing a support level. Notably, the Moving Average Convergence Divergence (MACD) signals diminishing bullish momentum, and the Relative Strength Index (RSI) is at 50. This suggests the possibility of the index extending its losses after a breakout, especially as the RSI has sharply retreated from overbought territory.
Resistance level: 104.50, 104.95
Support level: 103.70, 102.90
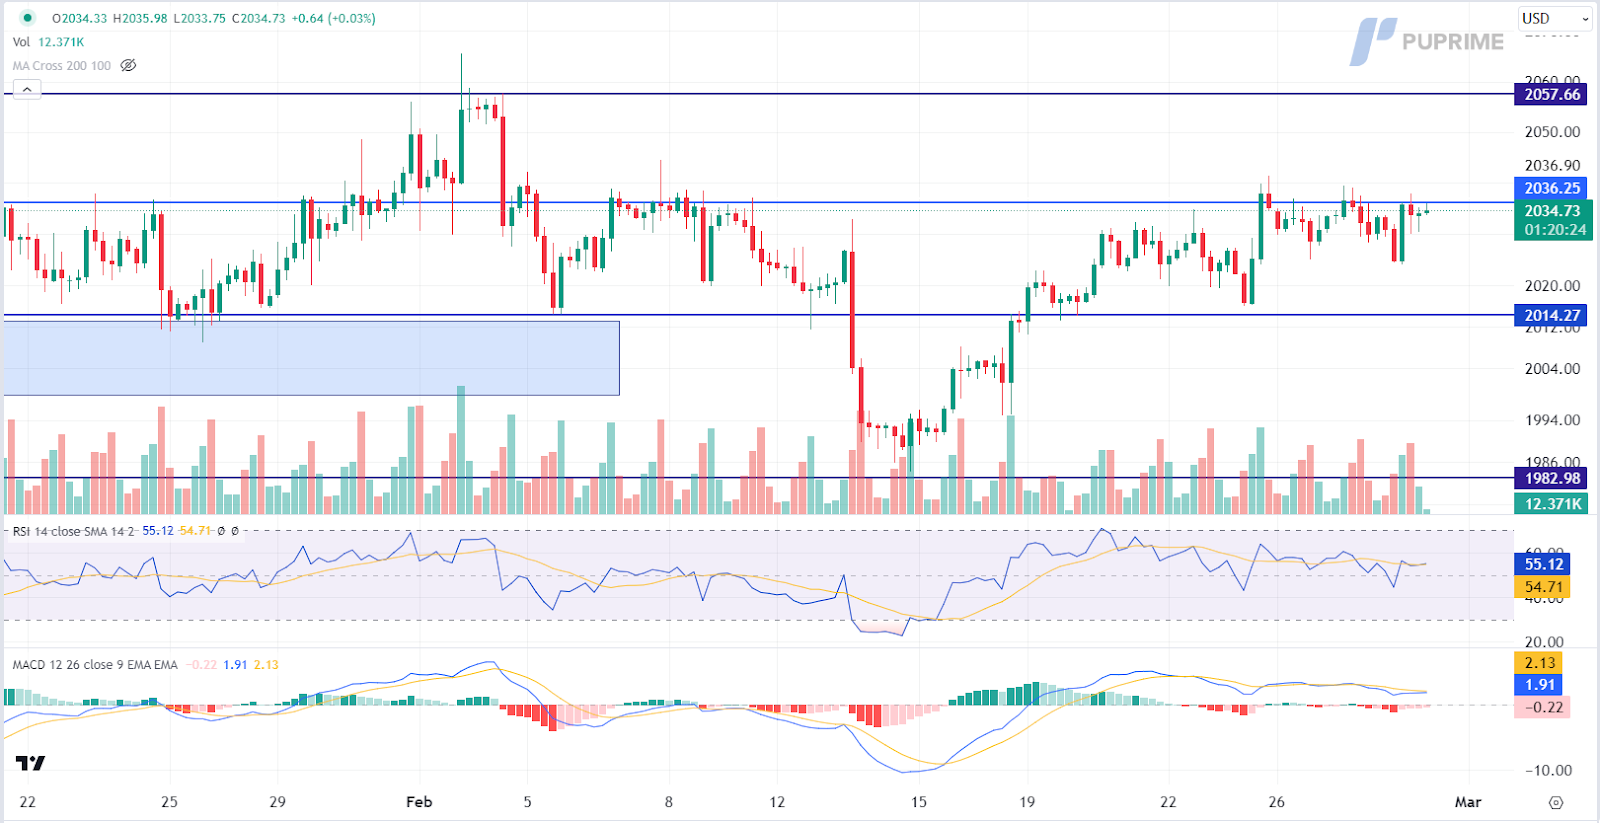
Gold prices have rebounded in response to a weakening US Dollar, driven by lackluster GDP data. The prevailing bullish momentum in the gold market is sustained by the challenges faced by the Greenback. The consolidation phase persists, and attention in the market is now directed towards the imminent US Core PCE Price Index. Investors are staying watchful, looking for cues from this pivotal data to navigate the gold market.
Currently, gold prices are trading higher and testing the resistance level. Notably, the Moving Average Convergence Divergence (MACD) indicates diminishing bearish momentum, and the Relative Strength Index (RSI) is at 55. This suggests the possibility of the commodity extending its gains after a breakout, particularly as the RSI remains above the midline.
Resistance level: 2035.00, 2060.00
Support level: 2015.00, 1985.00
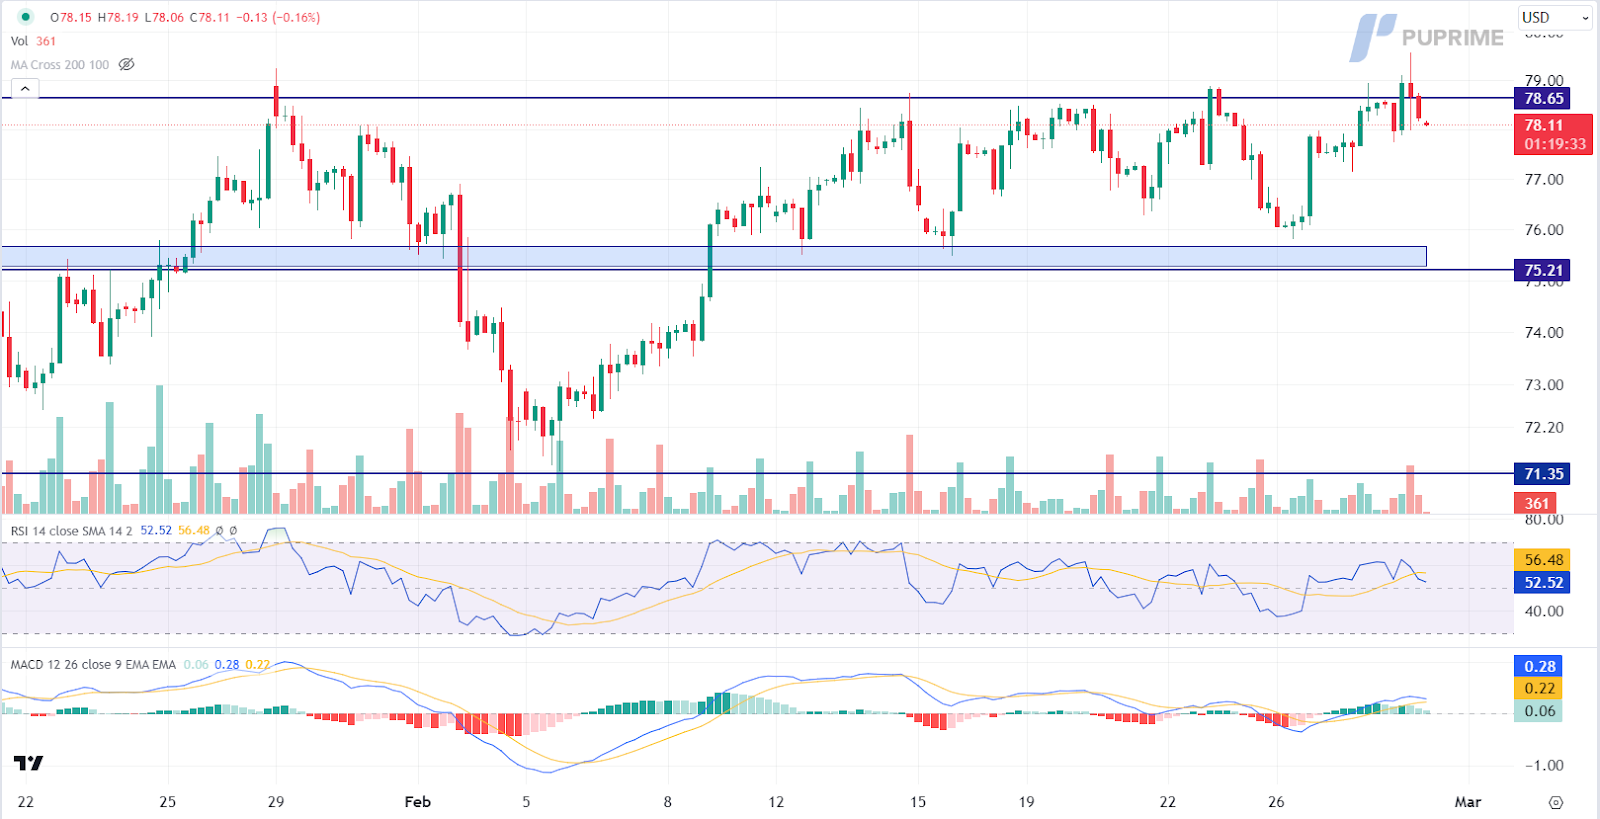
Crude oil prices experienced a slight retreat following a bearish Energy Information Administration (EIA) inventory report, which disclosed a significant increase from 3.514M to 4.199M, surpassing market expectations. US stockpiles registered a fifth consecutive week of growth, attributed to unplanned refinery outages post a winter storm. Nevertheless, losses are contained as analysts speculate that OPEC+ may consider extending voluntary oil output cuts into the second quarter, acting as a mitigating factor for oil prices.
Presently, oil prices are trading lower, having retraced from the resistance level. Notably, the Moving Average Convergence Divergence (MACD) signals diminishing bullish momentum, and the Relative Strength Index (RSI) stands at 52. This suggests the possibility of the commodity extending its losses, especially as the RSI has sharply retreated from overbought territory.
Resistance level: 78.65, 81.20
Support level: 75.20, 71.35

Trade with simulated capital and earn real profits after you pass our trader assessment.

20 May 2025, 06:46 Gold Slips as Ceasefire Hopes Curb Safe-Haven Demand

7 May 2025, 03:59 Geopolitical Risks and FOMC Uncertainty Shake Global Markets

6 May 2025, 05:53 Dollar Dips, Gold Rallies on U.S.-Taiwan Risk


New Registrations Unavailable
We’re not accepting new registrations at the moment.
While new sign ups are unavailable, existing users can continue their challenges and trading activities as usual.
Disclaimer: This website exclusively provides proprietary trading services. We do not engage in any regulated activities, offer investment management services, or manage funds on behalf of external clients. Our trading activities are conducted solely with the firm's own capital, and we do not accept client deposits or manage client accounts. It's important to note that none of the services we provide should be construed as investment or financial services in accordance with applicable laws.
This website offers services related to professional skill and experience assessment, which determine your eligibility to trade with the firm's capital. The outcome of these services is inherently determined by your individual skill level and ability to perform within the trading requirements and objectives outlined for each service separately. Clients are strongly advised to thoroughly understand the requirements of the services before signing up for any.
The content provided on this website is for informational purposes only and does not constitute financial, investment, or trading advice. The information presented is based on sources believed to be reliable, but we do not guarantee its accuracy, completeness, or timeliness. We disclaim any liability for any loss or damage arising directly or indirectly from the use of or reliance on the information provided on this website.
This website is not directed to residents of certain jurisdictions such as the United States, Singapore, Australia, China and some other specified regions, and is not intended for distribution to, or use by, any person in any countries or jurisdictions where such distribution or use would be contrary to local law or regulation.
This website is owned by Finzero Cap Ltd, a company incorporated in the Republic of Cyprus under registration number HE414308, with its registered office at 62 Athalassas, Mezzanine, Strovolos 2012, Nicosia, Cyprus. Finzero Cap Ltd serves as the authorized representative for PU Prime Ltd.
