Join the PU Xtrader Challenge Today
Trade with simulated capital and earn real profits after you pass our trader assessment.
Join the PU Xtrader Challenge Today
Trade with simulated capital and earn real profits after you pass our trader assessment.
28 February 2024,05:39
Daily Market AnalysisMarket Insights
28 February 2024, 05:39
* Gold prices and the Dollar index traded in a tight range ahead of the U.S. GDP.
* The Reserve Bank of New Zealand maintains an interest rate level of 5.50%, which weighs on the Kiwi.
* BTC prices maintain a 2-year high level, awaiting a fresh catalyst to break its hurdle.
The Dollar Index has shown little variation, registering a slight uptick of 0.02% in its most recent session, indicating a period of consolidation within a tight trading band. This comes as U.S. equity markets exhibit a sense of hesitancy, with investors poised for the imminent release of U.S. GDP data today and the Personal Consumption Expenditures (PCE) data set for Thursday. There is a prevailing expectation that GDP growth might have softened, a reflection of the stringent monetary tightening measures enacted since March 2022. A downturn in GDP growth could potentially weaken the U.S. dollar, albeit potentially buoying equity markets by tempering expectations for further monetary tightening.
In contrast, the New Zealand dollar witnessed a notable depreciation of nearly 1% in the Asia trading session, following the Reserve Bank of New Zealand’s (RBNZ) decision to hold interest rates steady at 5.50%. It was the dovish tone of the governor’s remarks, rather than the decision itself, that exerted downward pressure on the Kiwi, overshadowing the anticipation of maintained rates.
Meanwhile, oil prices remain at elevated levels, with market focus shifting towards the upcoming Chinese PMI data due for release on Friday. These PMI figures are pivotal for market participants, offering critical insights into the economic health of China, which is directly correlated with global crude oil demand.
Current rate hike bets on 20th March Fed interest rate decision:
Source: CME Fedwatch Tool
0 bps (92%) VS -25 bps (8%)
(MT4 System Time)

Source: MQL5
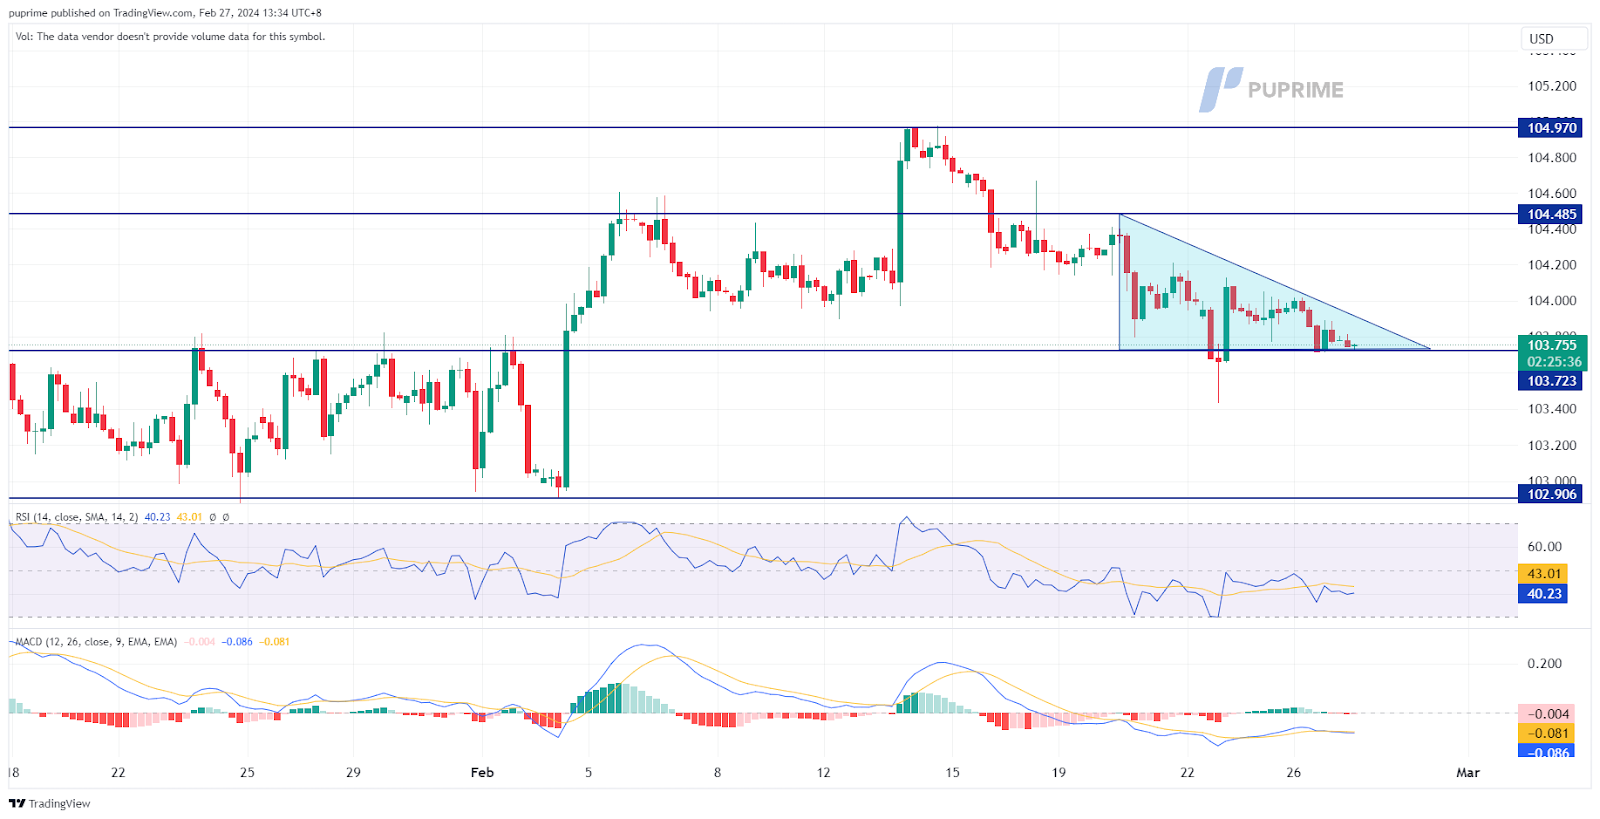
The Dollar Index continues to face persistent challenges against major currencies, grappling with a series of disappointing economic indicators. A significant drop in the US CB Consumer Confidence, falling from 110.9 to 106.7, highlights a prevailing sense of economic pessimism. The sharp decline in last month’s US Durable Goods Orders, plummeting from -0.30% to -6.1%, fell short of market expectations, collectively casting a shadow over the United States’ economic outlook and putting downward pressure on Dollar demand.
Presently, the Dollar Index is trading lower and is in the process of testing a crucial support level. Notably, the Moving Average Convergence Divergence (MACD) indicates a growing bullish momentum, and the Relative Strength Index (RSI) stands at 45, suggesting the possibility of a technical correction as the RSI sharply rebounded from oversold territory.
Resistance level: 104.50, 104.95
Support level: 103.70, 102.90
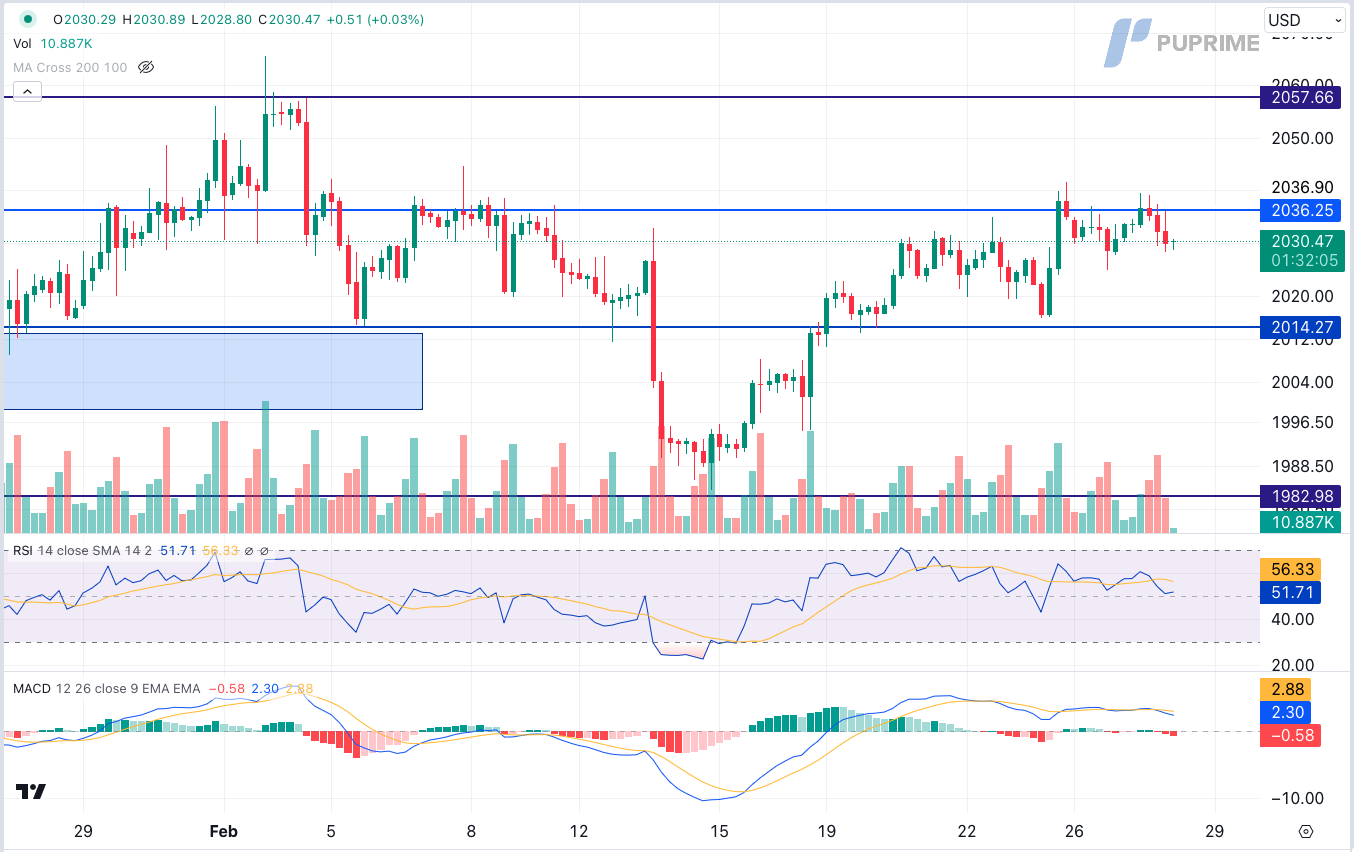
As the US Dollar exhibited weakness, gold prices continued their upward momentum, delicately hovering near a crucial resistance level. Despite this positive trend, investors maintained a cautious approach, anticipating significant economic data scheduled for later in the week. Market participants are eagerly awaiting key economic indicators, particularly the GDP and Core PCE data, as they seek insights that could decisively influence the market’s direction.
Currently, gold prices are trading higher and testing the resistance level. However, it’s noteworthy that the Moving Average Convergence Divergence (MACD) indicates an increasing bearish momentum, and the Relative Strength Index (RSI) is at 51. This suggests the possibility of a technical correction, especially as the RSI has retreated sharply from overbought territory.
Resistance level: 2035.00, 2060.00
Support level: 2015.00, 1985.0
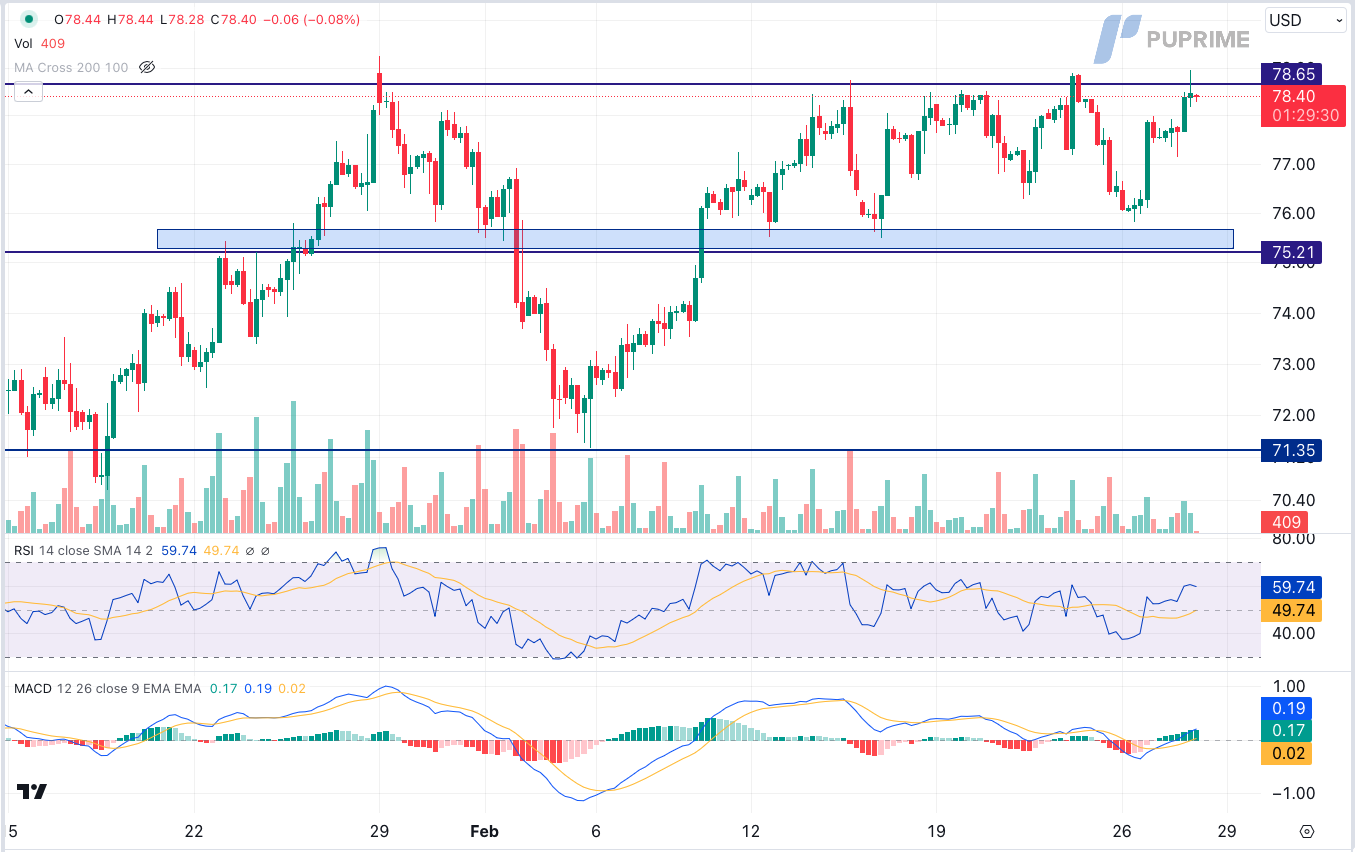
Oil prices have rebounded due to concerns about supply disruptions in the Middle East following attacks by Iran-aligned Houthis. Simultaneously, the market’s attention is fixed on the OPEC+ producer group, with analysts anticipating the continuation of production cuts, possibly until their March meeting, which could offer further support for oil prices.
Presently, oil prices are trading higher and testing the resistance level. Importantly, the Moving Average Convergence Divergence (MACD) indicates an increasing bullish momentum, and the Relative Strength Index (RSI) stands at 60. This suggests the possibility of the commodity extending its gains after a breakout, particularly as the RSI remains above the midline.
Resistance level: 78.65, 81.20
Support level: 75.20, 71.35

Trade with simulated capital and earn real profits after you pass our trader assessment.

20 May 2025, 06:46 Gold Slips as Ceasefire Hopes Curb Safe-Haven Demand

7 May 2025, 03:59 Geopolitical Risks and FOMC Uncertainty Shake Global Markets

6 May 2025, 05:53 Dollar Dips, Gold Rallies on U.S.-Taiwan Risk


New Registrations Unavailable
We’re not accepting new registrations at the moment.
While new sign ups are unavailable, existing users can continue their challenges and trading activities as usual.
Disclaimer: This website exclusively provides proprietary trading services. We do not engage in any regulated activities, offer investment management services, or manage funds on behalf of external clients. Our trading activities are conducted solely with the firm's own capital, and we do not accept client deposits or manage client accounts. It's important to note that none of the services we provide should be construed as investment or financial services in accordance with applicable laws.
This website offers services related to professional skill and experience assessment, which determine your eligibility to trade with the firm's capital. The outcome of these services is inherently determined by your individual skill level and ability to perform within the trading requirements and objectives outlined for each service separately. Clients are strongly advised to thoroughly understand the requirements of the services before signing up for any.
The content provided on this website is for informational purposes only and does not constitute financial, investment, or trading advice. The information presented is based on sources believed to be reliable, but we do not guarantee its accuracy, completeness, or timeliness. We disclaim any liability for any loss or damage arising directly or indirectly from the use of or reliance on the information provided on this website.
This website is not directed to residents of certain jurisdictions such as the United States, Singapore, Australia, China and some other specified regions, and is not intended for distribution to, or use by, any person in any countries or jurisdictions where such distribution or use would be contrary to local law or regulation.
This website is owned by Finzero Cap Ltd, a company incorporated in the Republic of Cyprus under registration number HE414308, with its registered office at 62 Athalassas, Mezzanine, Strovolos 2012, Nicosia, Cyprus. Finzero Cap Ltd serves as the authorized representative for PU Prime Ltd.
