Join the PU Xtrader Challenge Today
Trade with simulated capital and earn real profits after you pass our trader assessment.
Join the PU Xtrader Challenge Today
Trade with simulated capital and earn real profits after you pass our trader assessment.
23 February 2024,06:11
Daily Market AnalysisMarket Insights
23 February 2024, 06:11
* Upbeat Nvidia earnings report stirs up the U.S. stock markets.
* Improved U.S. Initial Jobless Claims fail to provide a catalyst for the dollar.
*Geopolitical tension continues to influence commodity prices, especially oil prices.
The U.S. equities market, with a spotlight on the Nasdaq, witnessed a notable ascendancy, reaching unprecedented highs, primarily propelled by Nvidia’s stellar earnings announcement. This development underscores a bullish outlook for the technology sector, reflecting in the Nasdaq’s significant 3% leap, pushing past the 18,000 threshold. Such a rally in the tech-centric index exemplifies the growing investor confidence in the sector’s growth potential and robust financial health. Concurrently, Chinese equity markets have demonstrated resilience, with both the China A50 and Hang Seng Index showcasing consistent weekly advances through February, signalling a rejuvenation in investor sentiment towards Chinese equities.
On the foreign exchange landscape, the U.S. Dollar Index has persisted in its trajectory below the 104 benchmark, subsequent to the dissemination of the minutes from the Federal Open Market Committee (FOMC) meeting. Despite encouraging employment data, the prevailing market consensus suggests a diminished likelihood of further interest rate hikes by the Federal Reserve, with a pivot towards rate reductions anticipated within the year. This shift in expectations has somewhat tempered the dollar’s vigour, as market participants recalibrate their outlook on the Fed’s future monetary policy stance.
In the realm of commodities, crude oil prices have registered a modest uptick of 0.4%, buoyed by positive U.S. crude inventory data. Nonetheless, the escalation of geopolitical tensions in the Middle East, marked by increased hostilities involving rebel factions deploying ballistic missiles and drones in the Red Sea region, continues to inject a degree of uncertainty and volatility into the oil market, influencing price dynamics.
Current rate hike bets on 20th March Fed interest rate decision:
Source: CME Fedwatch Tool
0 bps (92%) VS -25 bps (8%)
(MT4 System Time)

Source: MQL5

The Dollar Index initially experienced a retreat due to technical correction but staged a robust rebound following the release of exceptionally positive US economic data. Key indicators, including a decline in Initial Jobless Claims and better-than-expected readings in S&P Global US Manufacturing PMI and US Existing Home Sales, contributed to heightened market confidence in the trajectory of the US economy. However, the overall gains were moderated by less favourable results in S&P Global Services PMI.
The Dollar Index is trading higher, indicating a resurgence from the support level. The MACD (Moving Average Convergence Divergence) has shown diminishing bearish momentum, and the RSI (Relative Strength Index) is at 45, suggesting that the index might extend its gains, particularly since the RSI rebounded sharply from oversold territory.
Resistance level: 104.60, 105.70
Support level: 103.80, 103.00
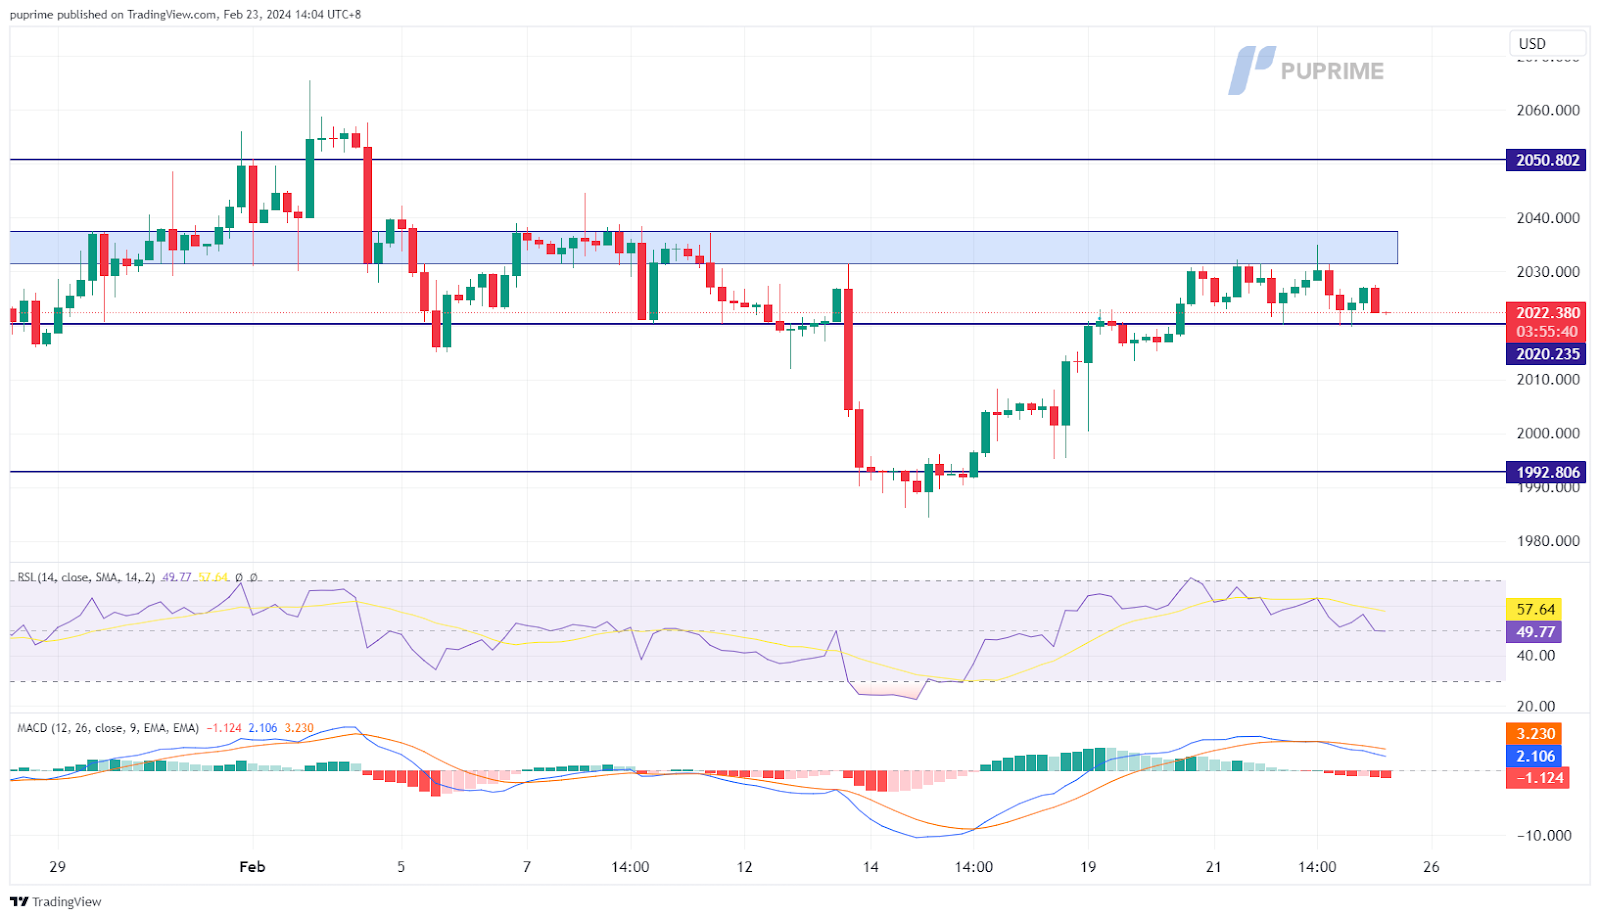
Gold prices witnessed a pullback amid market speculation that the Federal Reserve might delay rate cuts, following a series of stronger-than-expected US economic indicators. The subsequent rise in US Treasury yields, which tends to negatively affect non-yielding assets such as gold, was a key driver behind the precious metal’s decline. Nevertheless, ongoing geopolitical uncertainties in the Middle East have lent some support to gold’s safe-haven appeal, creating a nuanced market environment with potential for further consolidation.
gold prices are exhibiting a flat trajectory, hovering close to a critical support level. The MACD indicator points to increasing bearish momentum, while the RSI stands at 54. This positioning suggests that gold may face further downward pressure, particularly as the RSI has notably pulled back from previously overbought conditions.
Resistance level: 2035.00, 2060.00
Support level: 2015.00, 1985.00
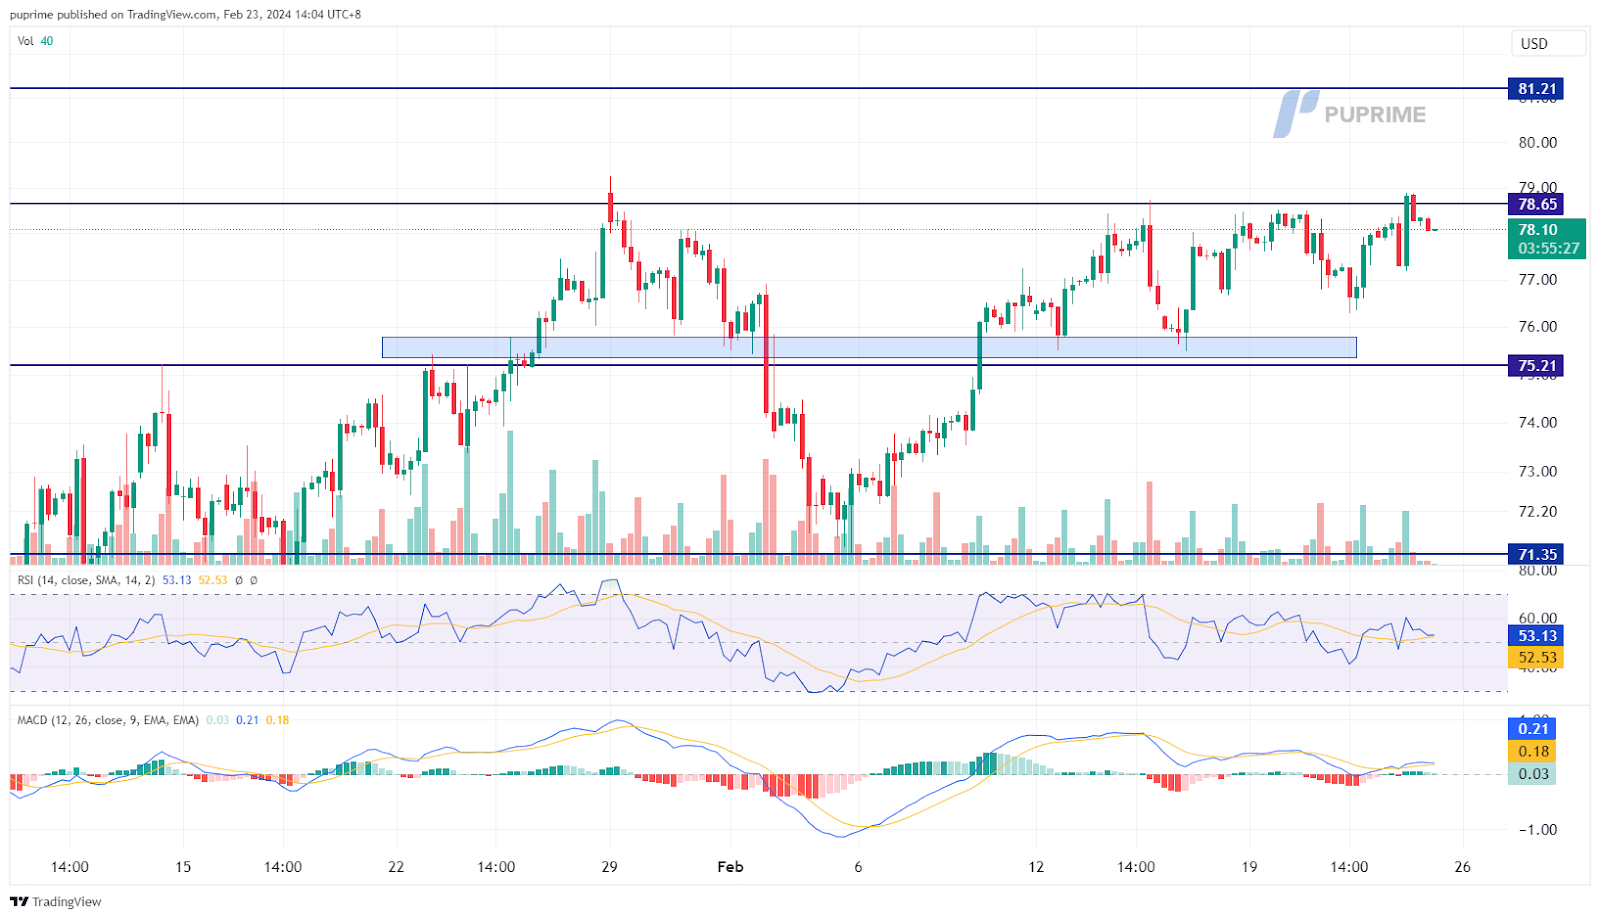
Crude oil prices saw a notable upswing, driven by an optimistic Energy Information Administration (EIA) inventory report that revealed a substantial reduction in US crude oil inventories. The data, indicating a decrease from 12.018 million barrels to 3.514 million barrels, exceeded market expectations. Additionally, mounting geopolitical tensions in the Middle East, characterised by Yemen’s Houthis threatening heightened attacks and introducing “submarine weapons,” heightened concerns about potential disruptions in the global oil supply.
oil prices are on an upward trajectory, testing the resistance level. The MACD indicator indicates an increasing bullish momentum, and the RSI is at 55, suggesting the possibility of further gains, particularly as the RSI maintains a position above the midline.
Resistance level: 78.65, 81.20
Support level:75.20, 71.35

Trade with simulated capital and earn real profits after you pass our trader assessment.

20 May 2025, 06:46 Gold Slips as Ceasefire Hopes Curb Safe-Haven Demand

7 May 2025, 03:59 Geopolitical Risks and FOMC Uncertainty Shake Global Markets

6 May 2025, 05:53 Dollar Dips, Gold Rallies on U.S.-Taiwan Risk


New Registrations Unavailable
We’re not accepting new registrations at the moment.
While new sign ups are unavailable, existing users can continue their challenges and trading activities as usual.
Disclaimer: This website exclusively provides proprietary trading services. We do not engage in any regulated activities, offer investment management services, or manage funds on behalf of external clients. Our trading activities are conducted solely with the firm's own capital, and we do not accept client deposits or manage client accounts. It's important to note that none of the services we provide should be construed as investment or financial services in accordance with applicable laws.
This website offers services related to professional skill and experience assessment, which determine your eligibility to trade with the firm's capital. The outcome of these services is inherently determined by your individual skill level and ability to perform within the trading requirements and objectives outlined for each service separately. Clients are strongly advised to thoroughly understand the requirements of the services before signing up for any.
The content provided on this website is for informational purposes only and does not constitute financial, investment, or trading advice. The information presented is based on sources believed to be reliable, but we do not guarantee its accuracy, completeness, or timeliness. We disclaim any liability for any loss or damage arising directly or indirectly from the use of or reliance on the information provided on this website.
This website is not directed to residents of certain jurisdictions such as the United States, Singapore, Australia, China and some other specified regions, and is not intended for distribution to, or use by, any person in any countries or jurisdictions where such distribution or use would be contrary to local law or regulation.
This website is owned by Finzero Cap Ltd, a company incorporated in the Republic of Cyprus under registration number HE414308, with its registered office at 62 Athalassas, Mezzanine, Strovolos 2012, Nicosia, Cyprus. Finzero Cap Ltd serves as the authorized representative for PU Prime Ltd.
