Join the PU Xtrader Challenge Today
Trade with simulated capital and earn real profits after you pass our trader assessment.
Join the PU Xtrader Challenge Today
Trade with simulated capital and earn real profits after you pass our trader assessment.
22 February 2024,05:46
Daily Market AnalysisMarket Insights
22 February 2024, 05:46
* Upbeat Nvidia earnings reports provide fresh momentum for U.S. Stock markets.
* FOMC meeting minutes showed board members stick with the current monetary policy, the dollar standing pat.
*Israel-Hamas tension intensified, oil and gold prices gained.
The Dollar Index displayed limited volatility in the aftermath of the highly anticipated release of the FOMC meeting minutes yesterday. As predicted, board members voiced apprehensions about the potential risks associated with swift rate cuts, emphasising a preference for maintaining elevated interest rates for an extended duration to avert potential harm to the economy. Despite a consensus that interest rates may have reached their peak, uncertainty remains regarding the timing of the first rate cut.
In the commodities market, Israel escalated its attacks on Gaza after unsuccessful ceasefire talks, instigating a more than 1% gain in oil prices in the last session. Concurrently, gold prices held firm above the $2020 level.
Furthermore, market participants are attentively observing economic indicators from the eurozone, including PMI readings and the Consumer Price Index (CPI), to gauge the euro’s strength. The intricate interplay of global geopolitical events, central bank communications, and economic data continues to mould market dynamics across diverse asset classes.
Current rate hike bets on 20th March Fed interest rate decision:
Source: CME Fedwatch Tool
0 bps (92%) VS -25 bps (8%)
(MT4 System Time)

Source: MQL5

The US Dollar maintains a neutral stance as the FOMC meeting minutes unveil a nuanced outlook, with Federal Reserve officials expressing both optimism and caution regarding inflation. The minutes reveal a sense of accomplishment in curbing inflation but underscore the need for a careful assessment of economic data before any rate-cutting decisions. The focus pivots back to US economic performance as the central bank remains deliberate in its approach.
The Dollar Index is currently trading lower, testing the support level. However, technical indicators such as MACD show diminishing bearish momentum, and RSI at 40 suggests the potential for a technical correction, especially as RSI rebounded sharply from oversold territory.
Resistance level: 104.60, 105.70
Support level: 103.80, 103.00
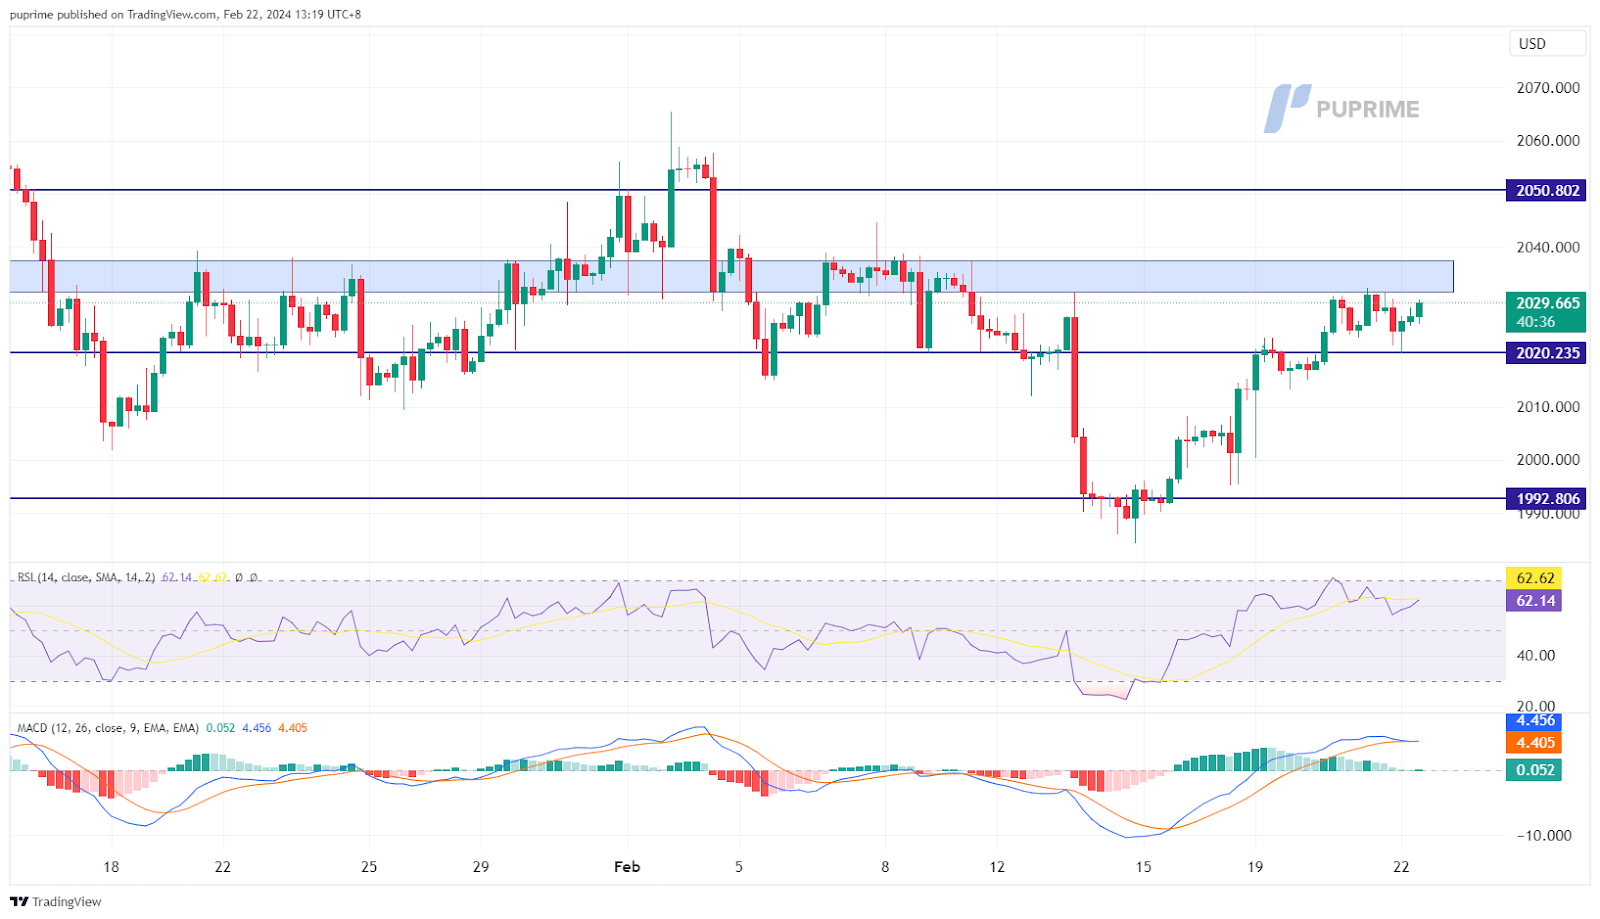
In the aftermath of the Federal Reserve’s cautious approach towards hastening interest rate cuts, gold prices witnessed a decline but managed to resiliently hold above the crucial support level of $2025. The prevailing risk-off sentiment in the market, fueled by ongoing uncertainties in Middle East tensions, is reinforcing gold’s safe-haven appeal amid a changing economic landscape.
Gold prices are currently trading lower following a retracement from the resistance level. The MACD indicates a rise in bearish momentum, while the RSI at 58 suggests the possibility of further losses, especially considering the sharp retreat of RSI from overbought territory.
Resistance level: 2035.00, 2060.00
Support level: 2015.00, 1985.00
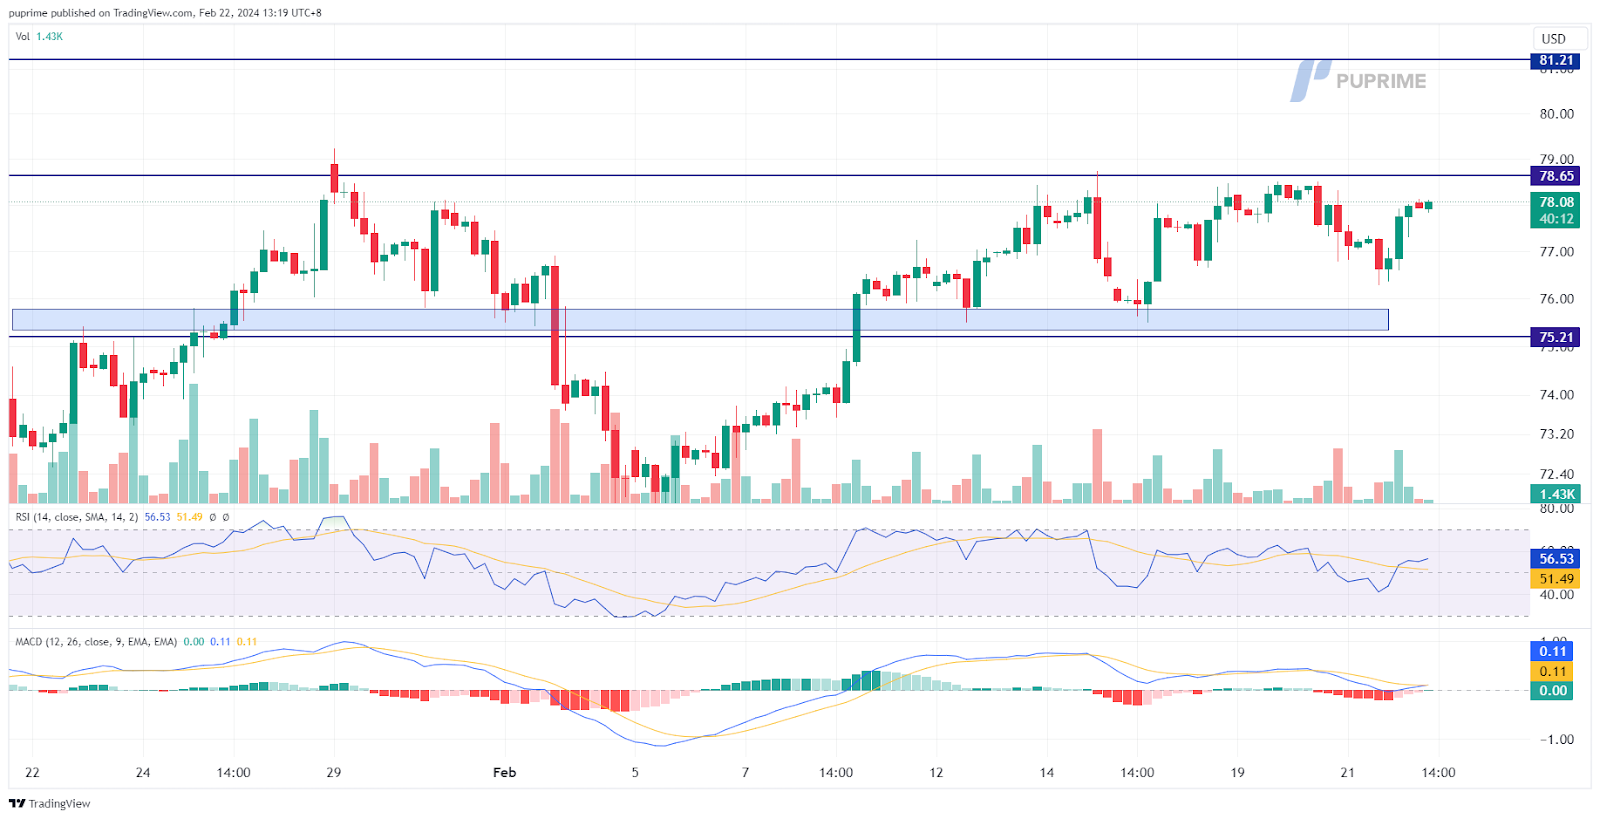
Crude oil prices are on the rise, driven by indications of tightening supplies amid escalating geopolitical tensions in the Middle East. Continued concerns over Houthi attacks on commercial vessels in the Red Sea are prompting a reassessment of short-term supply constraints. However, these gains are tempered by a bearish API inventory report that revealed a higher-than-expected increase in US crude inventories. All eyes are now on the upcoming EIA oil inventory report for further signals in the market.
Oil prices are currently trading higher, testing the resistance level. The MACD indicates a decrease in bearish momentum, while the RSI at 57 suggests the possibility of further gains following the breakout, as the RSI remains above the midline.
Resistance level: 78.65, 81.20
Support level:75.20, 71.35

Trade with simulated capital and earn real profits after you pass our trader assessment.

20 May 2025, 06:46 Gold Slips as Ceasefire Hopes Curb Safe-Haven Demand

7 May 2025, 03:59 Geopolitical Risks and FOMC Uncertainty Shake Global Markets

6 May 2025, 05:53 Dollar Dips, Gold Rallies on U.S.-Taiwan Risk


New Registrations Unavailable
We’re not accepting new registrations at the moment.
While new sign ups are unavailable, existing users can continue their challenges and trading activities as usual.
Disclaimer: This website exclusively provides proprietary trading services. We do not engage in any regulated activities, offer investment management services, or manage funds on behalf of external clients. Our trading activities are conducted solely with the firm's own capital, and we do not accept client deposits or manage client accounts. It's important to note that none of the services we provide should be construed as investment or financial services in accordance with applicable laws.
This website offers services related to professional skill and experience assessment, which determine your eligibility to trade with the firm's capital. The outcome of these services is inherently determined by your individual skill level and ability to perform within the trading requirements and objectives outlined for each service separately. Clients are strongly advised to thoroughly understand the requirements of the services before signing up for any.
The content provided on this website is for informational purposes only and does not constitute financial, investment, or trading advice. The information presented is based on sources believed to be reliable, but we do not guarantee its accuracy, completeness, or timeliness. We disclaim any liability for any loss or damage arising directly or indirectly from the use of or reliance on the information provided on this website.
This website is not directed to residents of certain jurisdictions such as the United States, Singapore, Australia, China and some other specified regions, and is not intended for distribution to, or use by, any person in any countries or jurisdictions where such distribution or use would be contrary to local law or regulation.
This website is owned by Finzero Cap Ltd, a company incorporated in the Republic of Cyprus under registration number HE414308, with its registered office at 62 Athalassas, Mezzanine, Strovolos 2012, Nicosia, Cyprus. Finzero Cap Ltd serves as the authorized representative for PU Prime Ltd.
