Join the PU Xtrader Challenge Today
Trade with simulated capital and earn real profits after you pass our trader assessment.
Join the PU Xtrader Challenge Today
Trade with simulated capital and earn real profits after you pass our trader assessment.
26 March 2024,06:54
Daily Market AnalysisMarket Insights
26 March 2024, 06:54
* U.S. inflation gauge saw bolstering Dollar’s strength, and all eyes are on Friday’s U.S. PCE.
* Japanese Yen strengthened on potential Japanese authority intervention as Yen traded to its weakest level.
* Gold prices rebounded amid geopolitical uncertainties in Europe and the Middle East.
The market’s calm demeanour in the recent session highlights the anticipation and uncertainty among investors regarding the Federal Reserve’s next moves. With the PCE index release on the horizon, it’s evident that market participants are treading cautiously. The Federal Reserve’s dilemma, balancing rate cuts amidst persistent inflation, continues to foster a wait-and-see attitude, leading to subdued activity across dollar index, equity markets, and gold. Oil’s continued ascent amidst the OPEC+ group’s commitment to production cuts and geopolitical tensions further underscores the complexities in the current market dynamics.
BTC’s recent performance, breaking past the $70,000 threshold after a week marked by significant ETF outflows, is a testament to the volatile and speculative nature of the cryptocurrency market. The quick rebound suggests a strong, albeit speculative, confidence among traders in the cryptocurrency’s value proposition.
As we inch closer to the end of the week, the release of the PCE index and remarks from Federal Reserve Chair Jerome Powell will be pivotal in setting the tone for market movements in the near term. Investors and traders alike will be keenly observing these developments for clearer indications of the Federal Reserve’s policy direction amidst the ongoing economic pressures.
Current rate hike bets on 1st May Fed interest rate decision:
Source: CME Fedwatch Tool
0 bps (90%) VS -25 bps (10%)
(MT4 System Time)

Source: MQL5
(MT4 System Time)

Source: MQL5

The Dollar Index maintained a neutral position as market participants adopted a cautious ‘wait-and-see’ approach, anticipating key insights into inflation dynamics and the Federal Reserve’s upcoming decisions. Attention remains on the upcoming release of the PCE Price Index, the Fed’s preferred inflation measure, amid the central bank’s focus on inflation approaching its 2% annual target as a prerequisite for potential interest rate adjustments in 2024. Amid prevailing market volatility, investors refrained from taking significant positions, leading to a flat trend for the dollar.
Currently, the Dollar Index is trading lower after retracing from the resistance level. The MACD indicator shows increasing bearish momentum, while the RSI stands at 56, suggesting the potential for further index losses following a sharp retreat from overbought territory
Resistance level: 104.45, 104.95
Support level:104.05, 103.75
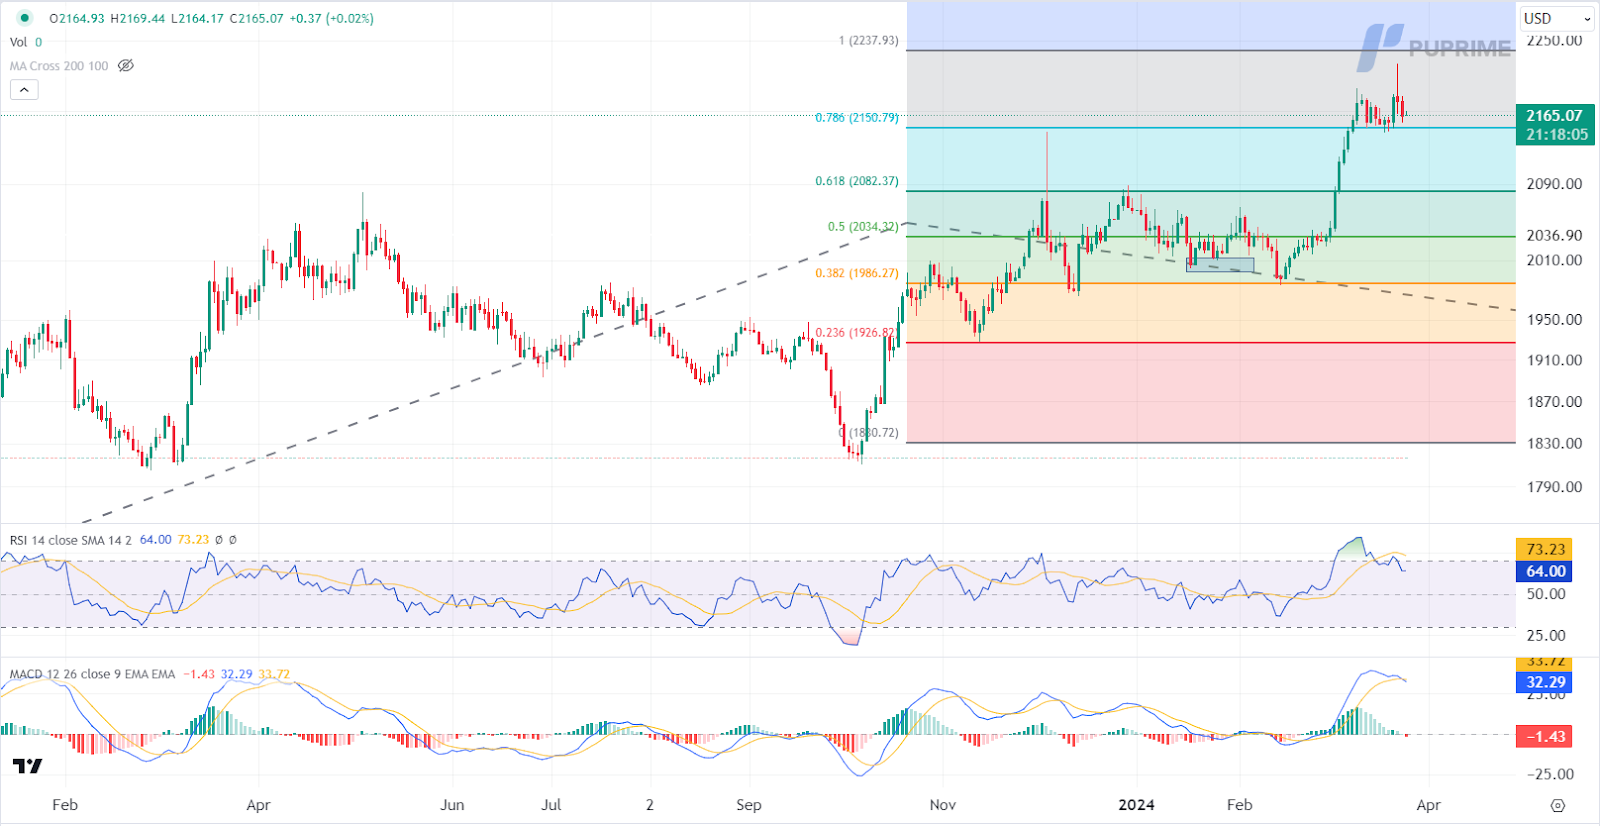
Despite a sharp retreat driven by hawkish sentiments from the Federal Reserve, gold prices managed to stabilise as some investors sought refuge in the safe-haven asset. However, the outlook for gold remains uncertain, with the potential for a Gaza ceasefire dampening demand, while increased market volatility ahead of key events could spark renewed interest in gold as a hedge.
Currently, gold prices are trading lower after breaking below the previous support level. However, the MACD indicator shows diminishing bearish momentum, while the RSI stands at 50, suggesting the possibility of continued consolidation within a range as the RSI remains near the midline.
Resistance level: 2185.00, 2230.00
Support level: 2145.00, 2110.00
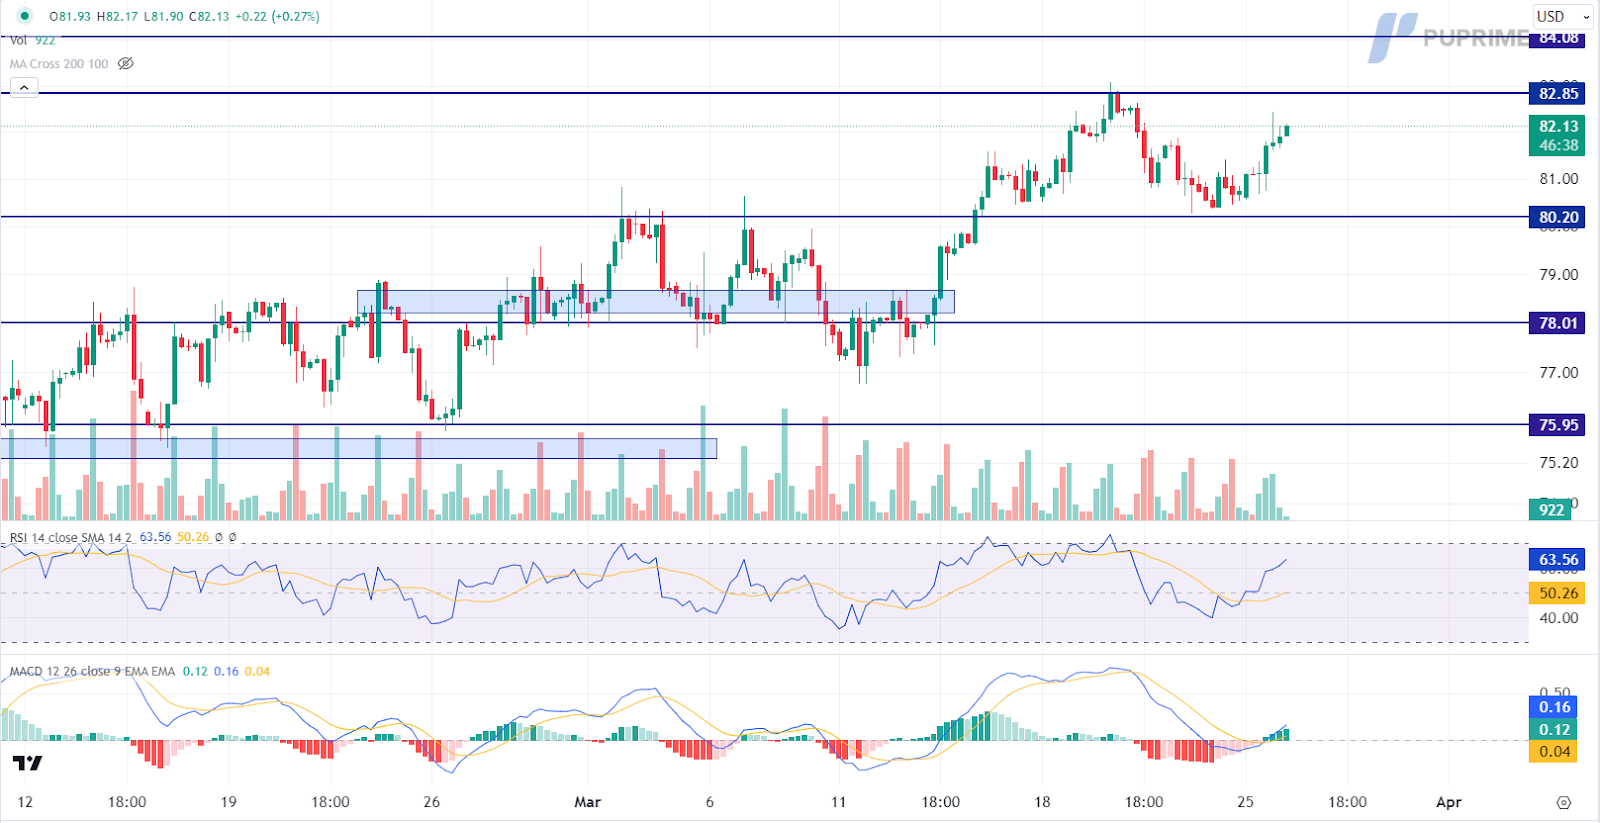
Crude oil prices surged amid a shift in market sentiment to bullish as expectations of tighter global crude supplies intensified. Reports of Russia’s decision to cut oil output to adhere to OPEC+ quotas, along with ongoing tensions in Ukraine targeting Russian refineries, raised concerns about potential supply disruptions. These developments fueled bullish momentum in oil markets, highlighting the prevailing volatility and uncertainty.
Currently, oil prices are trading higher and near the resistance level. The MACD indicator indicates increasing bullish momentum, while the RSI stands at 64, suggesting the possibility of further gains as the RSI remains above the midline.
Resistance level: 82.85, 84.10
Support level: 80.20, 78.00

Trade with simulated capital and earn real profits after you pass our trader assessment.

20 May 2025, 06:46 Gold Slips as Ceasefire Hopes Curb Safe-Haven Demand

7 May 2025, 03:59 Geopolitical Risks and FOMC Uncertainty Shake Global Markets

6 May 2025, 05:53 Dollar Dips, Gold Rallies on U.S.-Taiwan Risk


New Registrations Unavailable
We’re not accepting new registrations at the moment.
While new sign ups are unavailable, existing users can continue their challenges and trading activities as usual.
Disclaimer: This website exclusively provides proprietary trading services. We do not engage in any regulated activities, offer investment management services, or manage funds on behalf of external clients. Our trading activities are conducted solely with the firm's own capital, and we do not accept client deposits or manage client accounts. It's important to note that none of the services we provide should be construed as investment or financial services in accordance with applicable laws.
This website offers services related to professional skill and experience assessment, which determine your eligibility to trade with the firm's capital. The outcome of these services is inherently determined by your individual skill level and ability to perform within the trading requirements and objectives outlined for each service separately. Clients are strongly advised to thoroughly understand the requirements of the services before signing up for any.
The content provided on this website is for informational purposes only and does not constitute financial, investment, or trading advice. The information presented is based on sources believed to be reliable, but we do not guarantee its accuracy, completeness, or timeliness. We disclaim any liability for any loss or damage arising directly or indirectly from the use of or reliance on the information provided on this website.
This website is not directed to residents of certain jurisdictions such as the United States, Singapore, Australia, China and some other specified regions, and is not intended for distribution to, or use by, any person in any countries or jurisdictions where such distribution or use would be contrary to local law or regulation.
This website is owned by Finzero Cap Ltd, a company incorporated in the Republic of Cyprus under registration number HE414308, with its registered office at 62 Athalassas, Mezzanine, Strovolos 2012, Nicosia, Cyprus. Finzero Cap Ltd serves as the authorized representative for PU Prime Ltd.
