Join the PU Xtrader Challenge Today
Trade with simulated capital and earn real profits after you pass our trader assessment.
Join the PU Xtrader Challenge Today
Trade with simulated capital and earn real profits after you pass our trader assessment.
21 March 2024,06:09
Daily Market AnalysisMarket Insights
21 March 2024, 06:09
* Jerome Powell promised Fed rate cuts would remain on track; a dovish stance exerted pressure on the dollar.
* Gold prices, along with Dow Jones and S&P 500, all traded to all-time highs.
* The Japanese Yen strengthened for the first time in 8 days after the BoJ first rate hike since 2007.
The Federal Reserve’s decision to maintain interest rates within the 5.25% to 5.50% range, aligning with market expectations, was accompanied by a dovish tone from Fed Chair Jerome Powell. Despite signs of inflationary pressure, highlighted by the recent Producer Price Index (PPI) reading, Powell’s remarks suggested a willingness to consider rate cuts later in the year. This dovish stance led to a decline in the dollar index (DXY) by up to 0.6%, while simultaneously driving gold prices to a peak of $2222.90. Heightened geopolitical uncertainties, particularly in regions like Russia and Israel, combined with Japan’s recent rate hike, have increased market risk and boosted demand for gold as a safe-haven asset.
In the commodities market, oil prices saw an increase following the release of the American Petroleum Institute (API) crude inventories data, which indicated a significant decline in stockpiles. This positive data pushed oil prices towards the $84 mark. Additionally, the Japanese Yen strengthened for the first time in eight days as investors evaluated the potential interest rate divergence between Japan and the United States.
Current rate hike bets on 20th March Fed interest rate decision:
Source: CME Fedwatch Tool
0 bps (95%) VS -25 bps (5%)
(MT4 System Time)

Source: MQL5
(MT4 System Time)

Source: MQL5

The Dollar Index witnessed a significant downturn as the Federal Reserve reaffirmed its commitment to maintaining a dovish monetary policy stance, contrary to market expectations. Fed Chair Jerome Powell’s emphasis on the necessity of further economic data before considering any rate adjustments prompted investors to engage in profit-taking activities. All eyes now turn to forthcoming monetary policy decisions as analysts recalibrate their rate cut projections in response to the Fed’s cautious approach.
The Dollar Index is trading lower while currently testing the support level. MACD has illustrated increasing bearish momentum, while RSI is at 38, suggesting the index might extend its losses after breakout below the support level.
Resistance level: 103.70, 104.45
Support level:103.05, 102.55
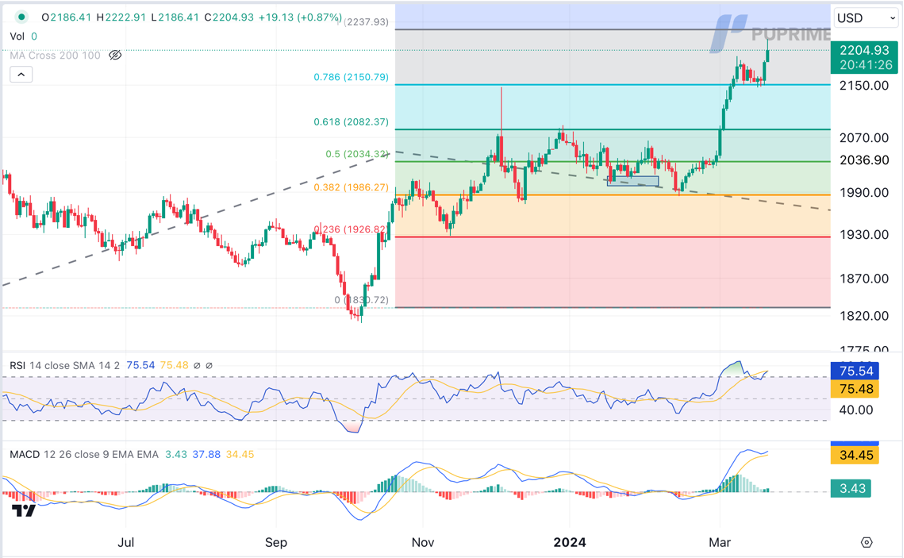
Gold prices surged sharply after the Federal Reserve reiterated its commitment to implementing rate cuts throughout 2024, despite recent inflationary pressures. Fed officials emphasized their view of current inflation levels as manageable and outlined a plan for further rate reductions totaling 100 basis points over the next two years. This dovish stance resulted in a decrease in US Treasury yields, leading to increased demand for gold as investors sought to hedge against potential currency devaluation.
Gold prices are currently trading higher after breaking out above the previous resistance level. However, the MACD indicator has shown diminishing bullish momentum, while the RSI stands at 76, suggesting that the commodity may enter overbought territory.
Resistance level: 2235.00, 2250.00
Support level: 2150.00, 2080.00
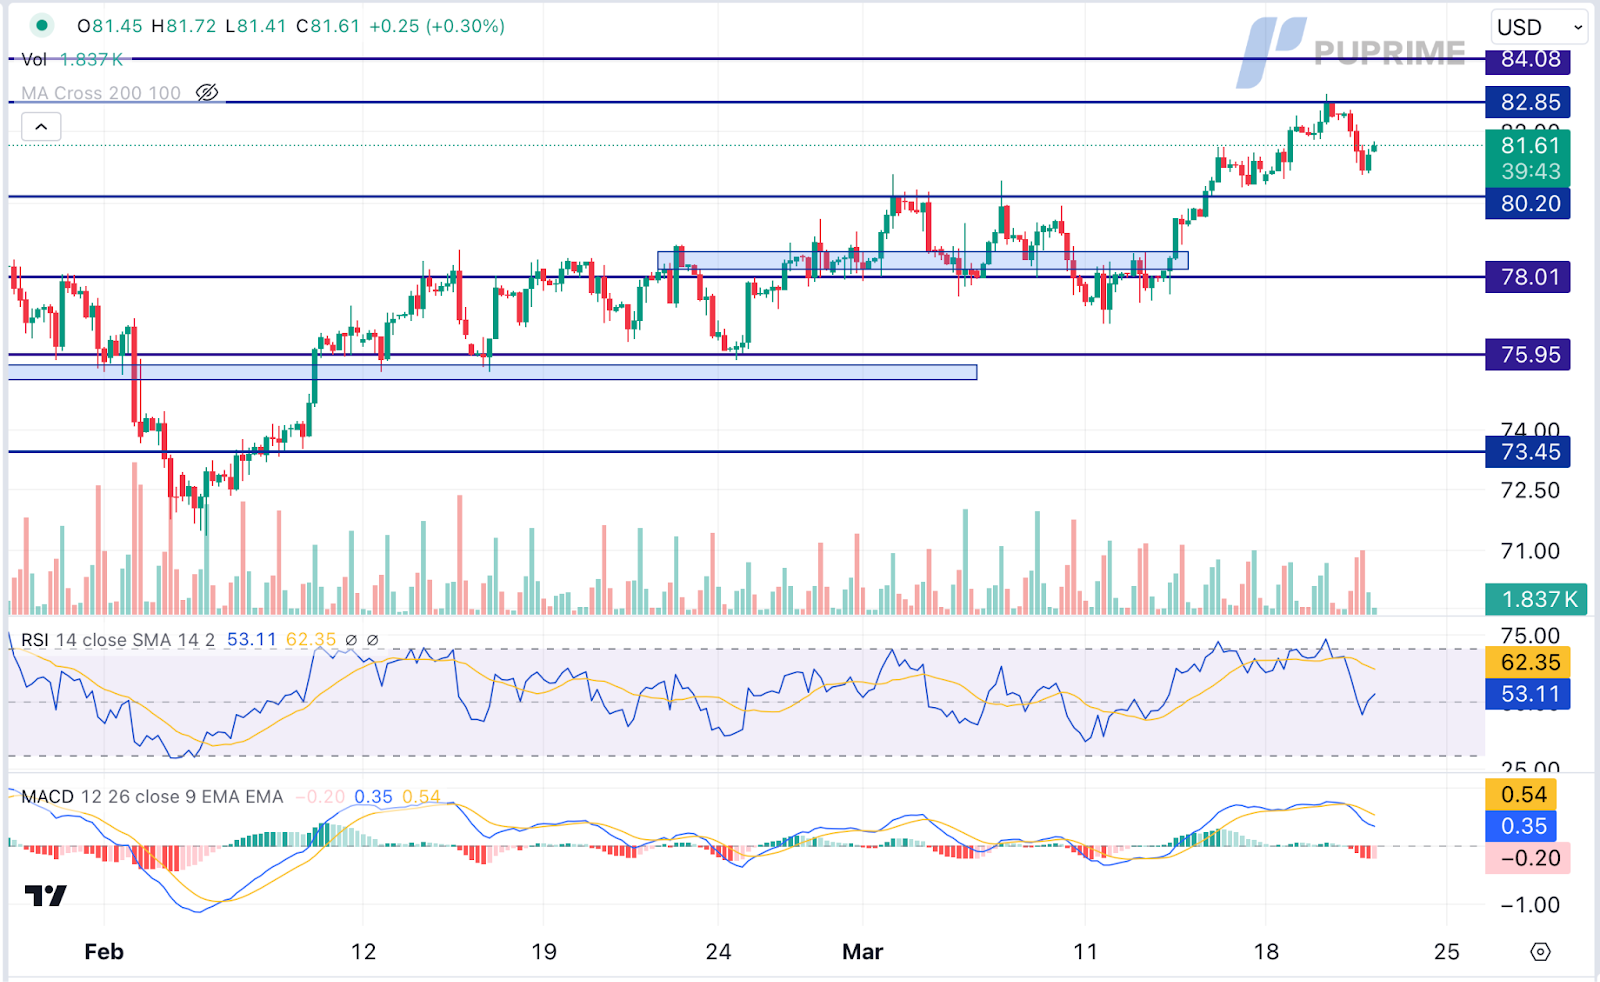
Crude oil prices initially faced downward pressure amidst heightened market uncertainty and risk aversion ahead of the Federal Reserve’s policy announcement. However, a modest recovery ensued during early Asian trading hours following a dovish stance from the Fed and positive inventory data. Notably, Energy Information Administration (EIA) statistics revealed a larger-than-anticipated decline in US crude oil inventories, providing support for oil prices amid ongoing market fluctuations.
Oil prices are currently trading higher after rebounding from the support level. The MACD indicator has shown diminishing bearish momentum, while the RSI stands at 53, suggesting that the commodity may extend its gains towards the resistance level, particularly since the RSI rebounded sharply from oversold territory.
Resistance level: 82.85, 84.10

Trade with simulated capital and earn real profits after you pass our trader assessment.

20 May 2025, 06:46 Gold Slips as Ceasefire Hopes Curb Safe-Haven Demand

7 May 2025, 03:59 Geopolitical Risks and FOMC Uncertainty Shake Global Markets

6 May 2025, 05:53 Dollar Dips, Gold Rallies on U.S.-Taiwan Risk


New Registrations Unavailable
We’re not accepting new registrations at the moment.
While new sign ups are unavailable, existing users can continue their challenges and trading activities as usual.
Disclaimer: This website exclusively provides proprietary trading services. We do not engage in any regulated activities, offer investment management services, or manage funds on behalf of external clients. Our trading activities are conducted solely with the firm's own capital, and we do not accept client deposits or manage client accounts. It's important to note that none of the services we provide should be construed as investment or financial services in accordance with applicable laws.
This website offers services related to professional skill and experience assessment, which determine your eligibility to trade with the firm's capital. The outcome of these services is inherently determined by your individual skill level and ability to perform within the trading requirements and objectives outlined for each service separately. Clients are strongly advised to thoroughly understand the requirements of the services before signing up for any.
The content provided on this website is for informational purposes only and does not constitute financial, investment, or trading advice. The information presented is based on sources believed to be reliable, but we do not guarantee its accuracy, completeness, or timeliness. We disclaim any liability for any loss or damage arising directly or indirectly from the use of or reliance on the information provided on this website.
This website is not directed to residents of certain jurisdictions such as the United States, Singapore, Australia, China and some other specified regions, and is not intended for distribution to, or use by, any person in any countries or jurisdictions where such distribution or use would be contrary to local law or regulation.
This website is owned by Finzero Cap Ltd, a company incorporated in the Republic of Cyprus under registration number HE414308, with its registered office at 62 Athalassas, Mezzanine, Strovolos 2012, Nicosia, Cyprus. Finzero Cap Ltd serves as the authorized representative for PU Prime Ltd.
