Join the PU Xtrader Challenge Today
Trade with simulated capital and earn real profits after you pass our trader assessment.
Join the PU Xtrader Challenge Today
Trade with simulated capital and earn real profits after you pass our trader assessment.
20 March 2024,05:44
Daily Market AnalysisMarket Insights
20 March 2024, 05:44
* The Japanese Yen plunged after the BoJ announced its first rate hike since 2007.
* All eyes will be on the FOMC interest rate decision due today.
* The Reserve Bank of Australia’s dovish tone after announcing its interest rate decision hammers the Australian dollar lower.
The Bank of Japan (BoJ) made a significant policy shift, marking its first rate hike since 2007 and ending its yield curve control (YCC) policy. Despite maintaining government bond purchases, this “dovish hike” weakened the Japanese Yen, making it the weakest among major currencies and driving it to its lowest level against the dollar since November.
Attention now turns to the Federal Open Market Committee (FOMC) and its upcoming interest rate decision. Market expectations lean towards a hawkish stance, particularly after last week’s higher-than-expected Producer Price Index (PPI) readings, indicating potential inflationary pressures.
In commodities, gold prices remain steady as investors await the FOMC’s decision. Oil prices are at recent highs, with investors also eyeing the Fed’s decision and the release of the weekly American Petroleum Institute (API) crude data later today.
Current rate hike bets on 20th March Fed interest rate decision:
Source: CME Fedwatch Tool
0 bps (95%) VS -25 bps (5%)
(MT4 System Time)

Source: MQL5
(MT4 System Time)

Source: MQL5

Amidst a yen selloff, investors turned to the safe-haven dollar, resulting in positive gains. As central bank decisions take center stage in currency markets, especially the Federal Reserve’s impending announcement, all eyes are on potential interest rate adjustments and monetary policy statements. Market expectations lean towards the Fed maintaining its current interest rate range of 5.25% to 5.50%, with close attention to the bank’s guidance for future actions.
The Dollar Index is currently trading higher after breaking above the previous resistance level. However, the MACD indicator shows diminishing bullish momentum, while the RSI stands at 72, indicating potential technical correction as it enters overbought territory.
Resistance level: 104.45, 104.95
Support level: 103.70, 103.05
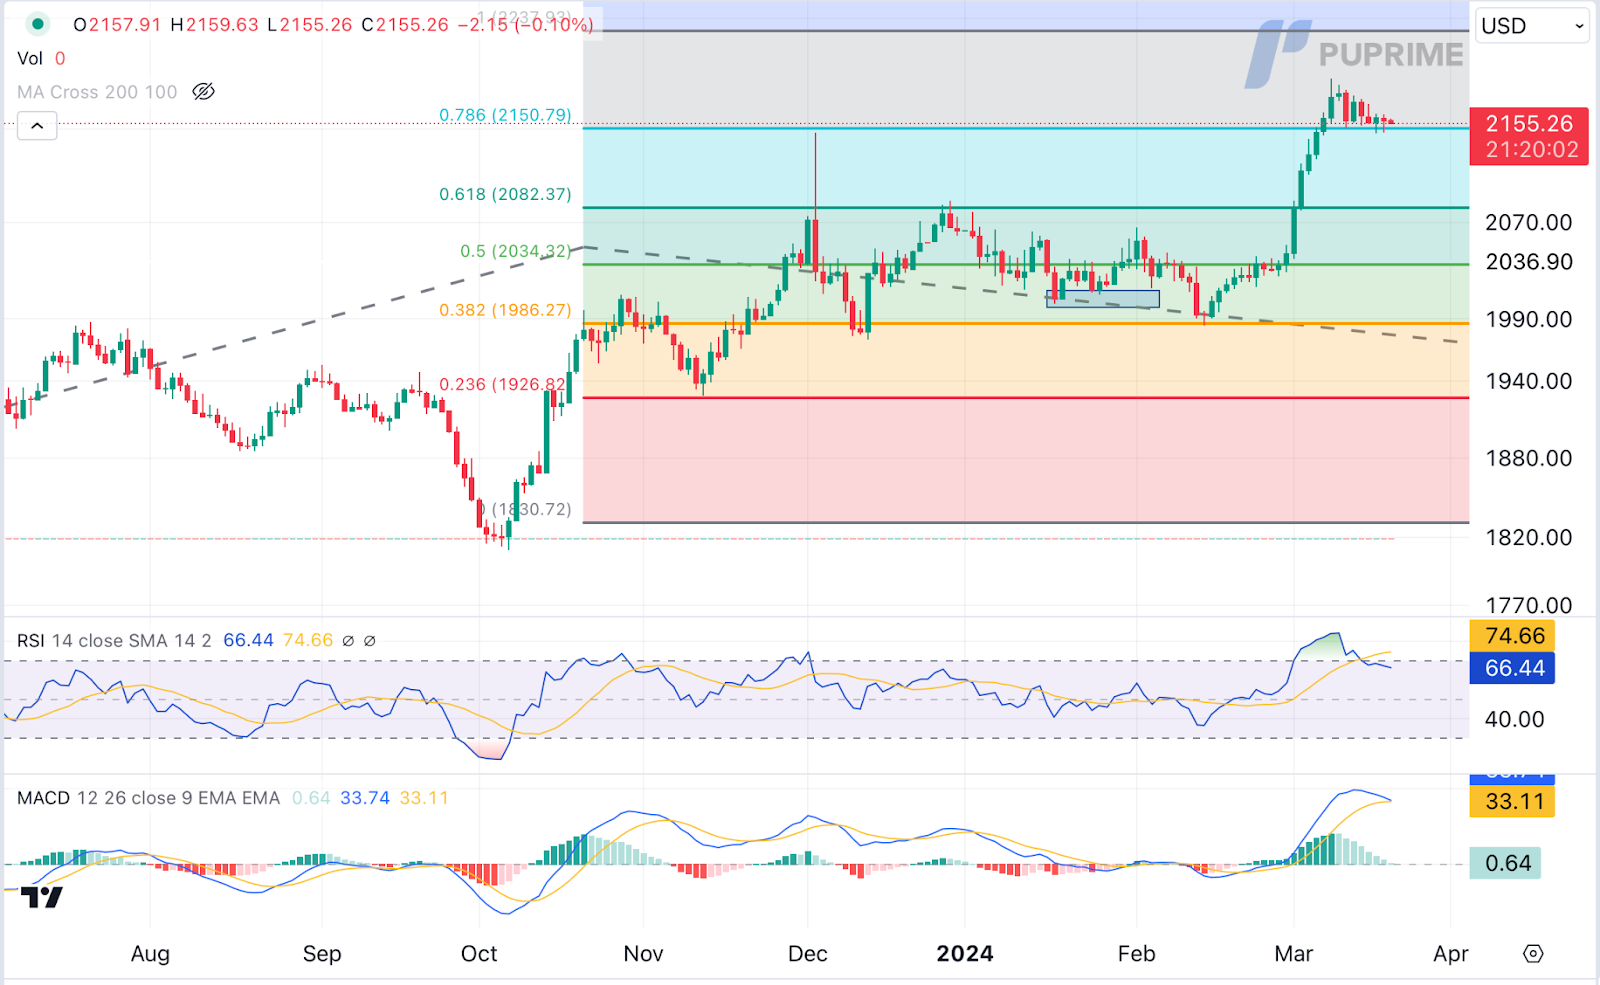
Better-than-expected inflation data from the US sparked expectations of a hawkish stance from the Federal Reserve in its upcoming interest rate decision. As a result, US Treasury yields rose alongside the dollar, leading to a selloff in non-yielding assets such as gold. However, gold prices may consolidate within a range ahead of significant events, prompting investors to stay vigilant for further trading signals, particularly from the Fed’s monetary policy decisions.
Gold prices are currently trading lower as they test the support level. The MACD indicator shows diminishing bullish momentum, while the RSI stands at 66, suggesting the commodity may extend its losses after breaking out, given the sharp retreat from overbought territory.
Resistance level: 2150.00, 2235.00
Support level: 2080.00, 2035.00
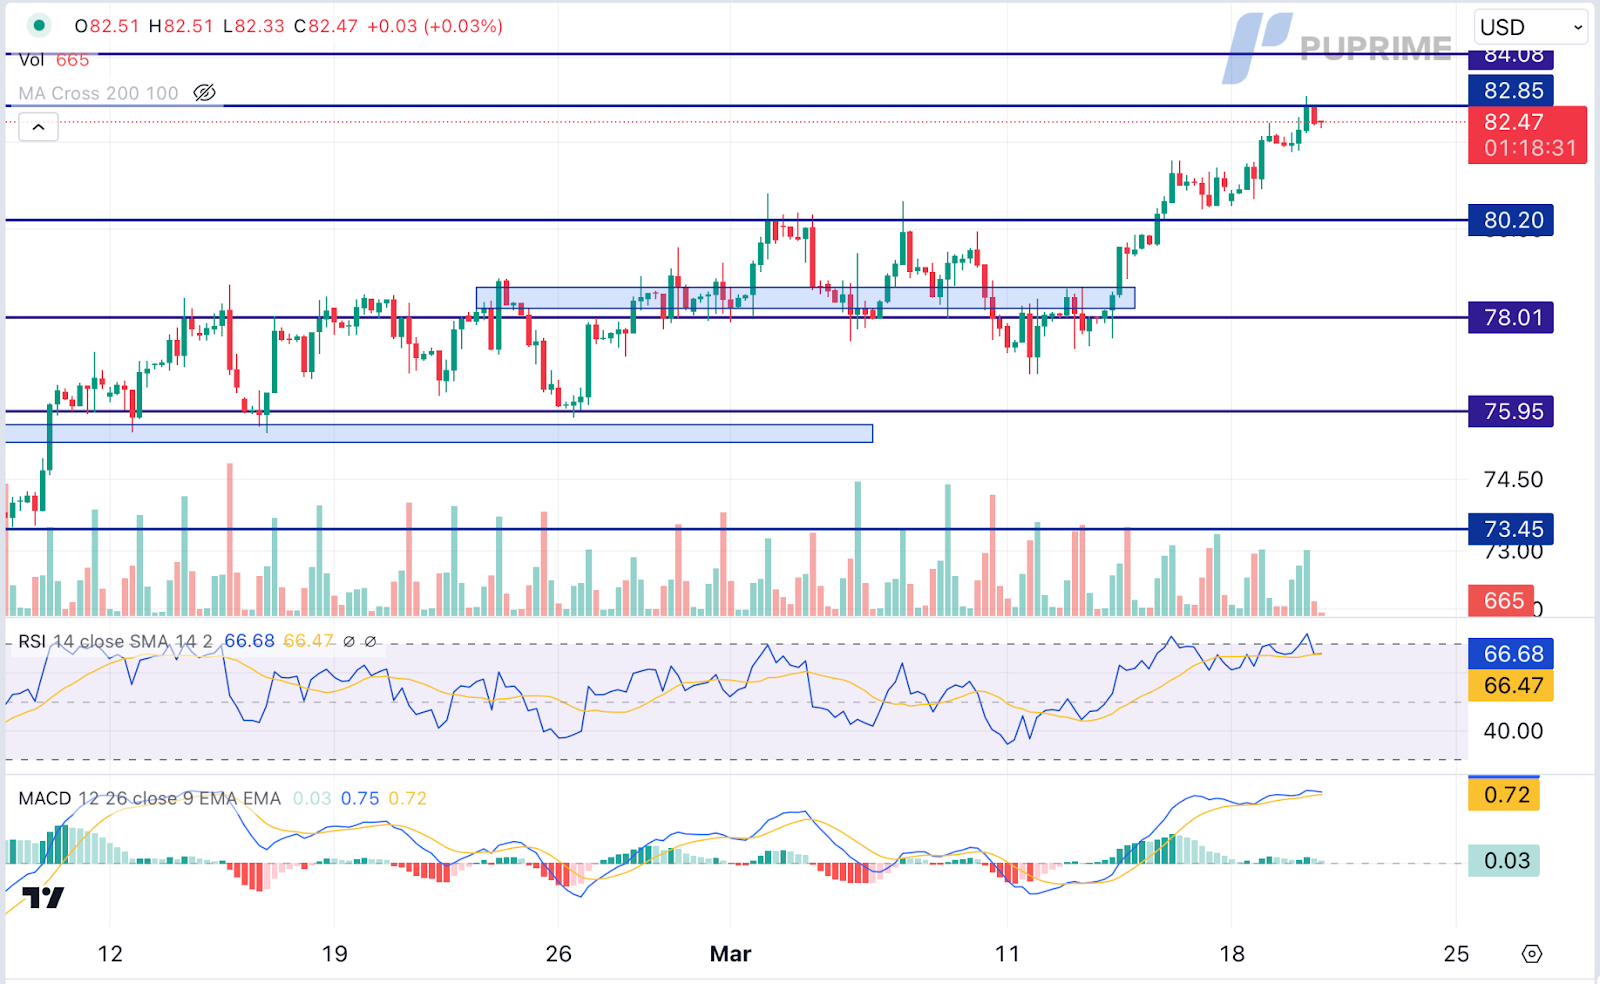
Crude oil prices continued their upward trajectory, surging to multi-month highs for the second consecutive session, driven by escalating geopolitical tensions. Recent attacks by Ukraine on Russian refineries heightened concerns over supply disruptions, particularly as the attacks targeted a significant portion of Russian refining capacity. This resulted in the shutdown of approximately 7% of daily refining output, amplifying fears of supply shortages and underlining the volatile nature of global oil markets.
Oil prices are currently trading higher as they test the resistance level. However, the MACD indicator shows diminishing bullish momentum, while the RSI stands at 67, suggesting the commodity may experience a technical correction given that the RSI has entered the overbought territory.
Resistance level: 82.85, 84.10
Support level: 80.20, 78.00

Trade with simulated capital and earn real profits after you pass our trader assessment.

20 May 2025, 06:46 Gold Slips as Ceasefire Hopes Curb Safe-Haven Demand

7 May 2025, 03:59 Geopolitical Risks and FOMC Uncertainty Shake Global Markets

6 May 2025, 05:53 Dollar Dips, Gold Rallies on U.S.-Taiwan Risk


New Registrations Unavailable
We’re not accepting new registrations at the moment.
While new sign ups are unavailable, existing users can continue their challenges and trading activities as usual.
Disclaimer: This website exclusively provides proprietary trading services. We do not engage in any regulated activities, offer investment management services, or manage funds on behalf of external clients. Our trading activities are conducted solely with the firm's own capital, and we do not accept client deposits or manage client accounts. It's important to note that none of the services we provide should be construed as investment or financial services in accordance with applicable laws.
This website offers services related to professional skill and experience assessment, which determine your eligibility to trade with the firm's capital. The outcome of these services is inherently determined by your individual skill level and ability to perform within the trading requirements and objectives outlined for each service separately. Clients are strongly advised to thoroughly understand the requirements of the services before signing up for any.
The content provided on this website is for informational purposes only and does not constitute financial, investment, or trading advice. The information presented is based on sources believed to be reliable, but we do not guarantee its accuracy, completeness, or timeliness. We disclaim any liability for any loss or damage arising directly or indirectly from the use of or reliance on the information provided on this website.
This website is not directed to residents of certain jurisdictions such as the United States, Singapore, Australia, China and some other specified regions, and is not intended for distribution to, or use by, any person in any countries or jurisdictions where such distribution or use would be contrary to local law or regulation.
This website is owned by Finzero Cap Ltd, a company incorporated in the Republic of Cyprus under registration number HE414308, with its registered office at 62 Athalassas, Mezzanine, Strovolos 2012, Nicosia, Cyprus. Finzero Cap Ltd serves as the authorized representative for PU Prime Ltd.
