Join the PU Xtrader Challenge Today
Trade with simulated capital and earn real profits after you pass our trader assessment.
Join the PU Xtrader Challenge Today
Trade with simulated capital and earn real profits after you pass our trader assessment.
11 March 2024,05:01
Daily Market AnalysisMarket Insights
11 March 2024, 05:01
* The Dollar plunged on poor economic data, Unemployment rate and Average Hourly Earnings both came short, while Nonfarm Payrolls beat market expectations.
* Gold prices reach new highs driven by a pessimistic US economic outlook, upcoming US inflation report is highly anticipated.
The US Dollar faces challenges as key employment indicators present a mixed picture, with a disappointing unemployment rate and hourly earnings figures contrasting with a robust non-farm payroll report. The US Unemployment rate and Average Hourly Earnings came in at 3.90% and 0.10%, respectively, both worse than the expected 3.70% and 0.2%. However, the US Nonfarm Payrolls showed significant improvement, rising from 229K to 275K, surpassing the market expectations of 198K. Gold prices are on the rise due to a weakening dollar and expectations of Fed interest rate cuts. Meanwhile, Crude oil experiences a slight dip amid concerns over soft Chinese demand and a conservative economic growth target, with attention shifting to potential rate cuts by major central banks to stimulate oil demand and foster economic growth.
Current rate hike bets on 20th March Fed interest rate decision:
Source: CME Fedwatch Tool
0 bps (95%) VS -25 bps (5%)
(MT4 System Time)

Source: MQL5

The US Dollar grapples with losses as key employment indicators present a mixed picture. The disappointing unemployment rate and hourly earnings figures contrast with a robust non-farm payroll report, leaving the greenback in a delicate position. Bloomberg reports reveal that Federal Reserve Chair Jerome Powell and colleagues are moving closer to revising their inflation strategy. Powell emphasises the need for “just a bit more evidence” before considering a shift in the central bank’s approach.
The Dollar Index is trading lower following the prior breakout below the previous support level. However, MACD has illustrated diminishing bearish momentum, while RSI is at 28, suggesting the index might enter oversold territory.
Resistance levels: 103.70, 104.50
Support levels: 102.10, 101.35
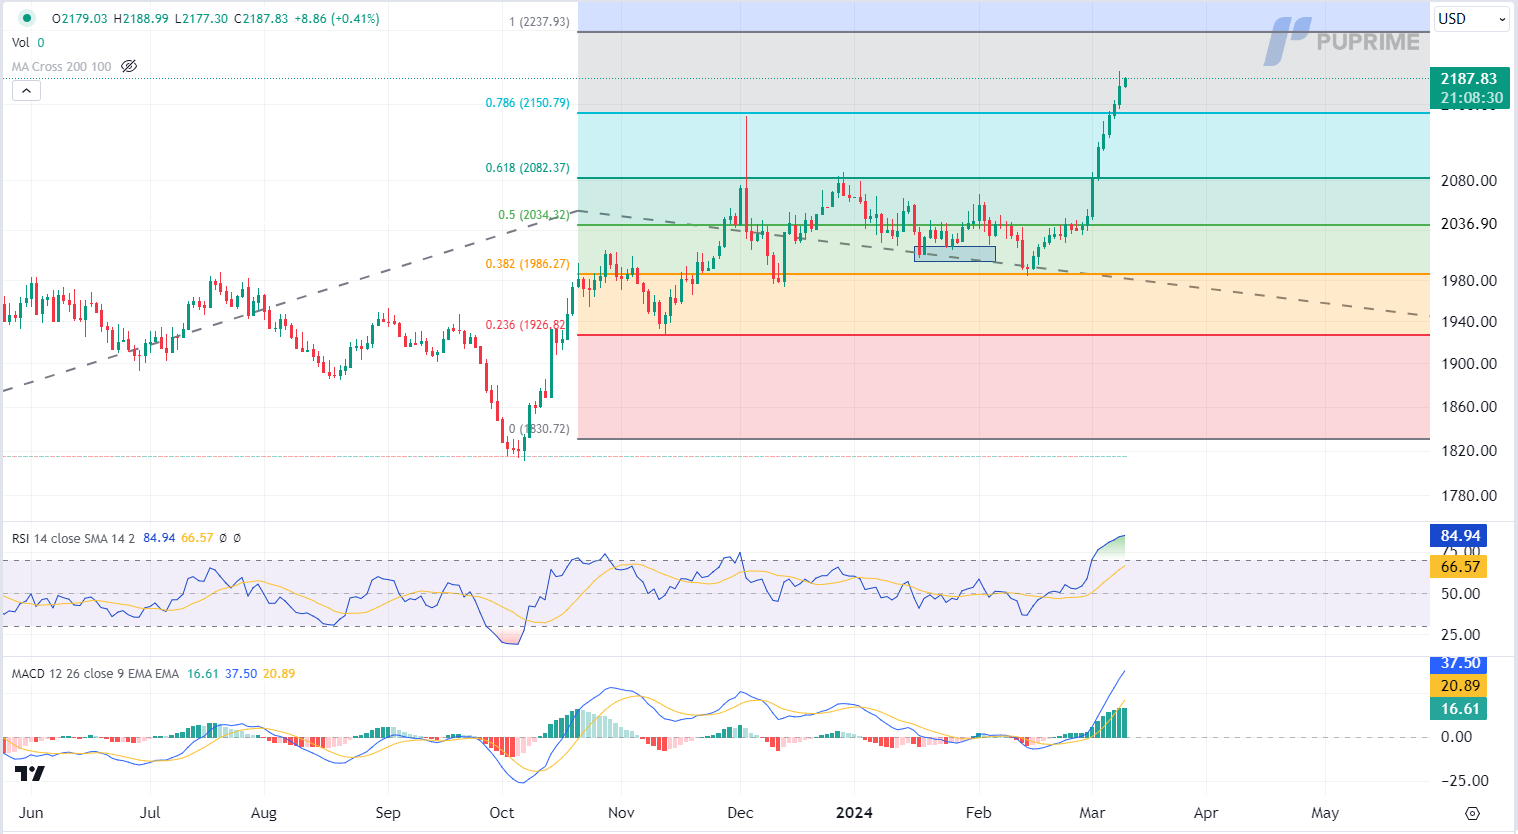
Gold prices enjoy continued gains, propelled by a weakening US Dollar. A series of lackluster US economic data, coupled with dovish statements from the Federal Reserve, diminish the appeal of the greenback. The focus shifts to forthcoming inflation reports, where a continued decline in US inflation may heighten expectations for Fed interest rate cuts, further supporting gold market demand.
Gold prices are trading higher following the prior breakout above the previous resistance level. The Moving Average Convergence Divergence (MACD) has illustrated increasing bullish momentum. However, the Relative Strength Index (RSI) is at 85, suggesting the commodity might enter overbought territory.
Resistance levels: 2235.00, 2350.00
Support levels: 2150.00, 2080.00
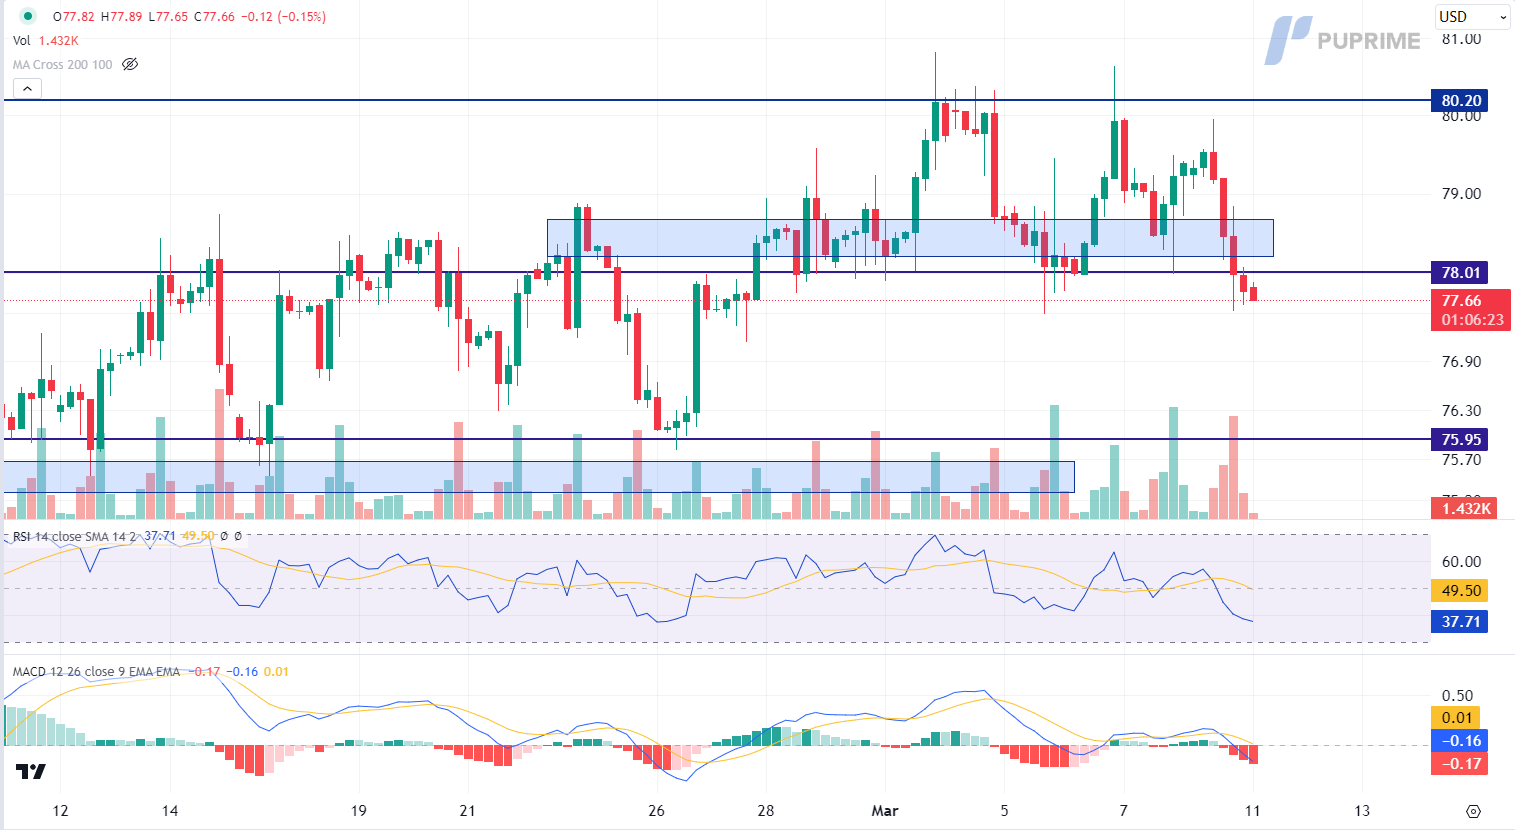
Crude oil prices experience a slight dip as apprehensions persist over soft Chinese demand. Despite OPEC+ extending supply cuts, China’s conservative economic growth target of around 5% for 2024 raises concerns. Analysts emphasize the challenging outlook without additional stimulus measures. Attention shifts to major central banks’ potential rate cuts, including the Federal Reserve and the ECB, as lower rates could stimulate oil demand by fostering economic growth.
Oil prices are trading lower following the prior breakout below the previous support level. The Moving Average Convergence Divergence (MACD) has illustrated increasing bearish momentum, while the Relative Strength Index (RSI) is at 38, suggesting the commodity might extend its losses since the RSI stays below the midline.
Resistance levels: 78.00, 80.20
Support levels: 75.95, 73.45

Trade with simulated capital and earn real profits after you pass our trader assessment.

20 May 2025, 06:46 Gold Slips as Ceasefire Hopes Curb Safe-Haven Demand

7 May 2025, 03:59 Geopolitical Risks and FOMC Uncertainty Shake Global Markets

6 May 2025, 05:53 Dollar Dips, Gold Rallies on U.S.-Taiwan Risk


New Registrations Unavailable
We’re not accepting new registrations at the moment.
While new sign ups are unavailable, existing users can continue their challenges and trading activities as usual.
Disclaimer: This website exclusively provides proprietary trading services. We do not engage in any regulated activities, offer investment management services, or manage funds on behalf of external clients. Our trading activities are conducted solely with the firm's own capital, and we do not accept client deposits or manage client accounts. It's important to note that none of the services we provide should be construed as investment or financial services in accordance with applicable laws.
This website offers services related to professional skill and experience assessment, which determine your eligibility to trade with the firm's capital. The outcome of these services is inherently determined by your individual skill level and ability to perform within the trading requirements and objectives outlined for each service separately. Clients are strongly advised to thoroughly understand the requirements of the services before signing up for any.
The content provided on this website is for informational purposes only and does not constitute financial, investment, or trading advice. The information presented is based on sources believed to be reliable, but we do not guarantee its accuracy, completeness, or timeliness. We disclaim any liability for any loss or damage arising directly or indirectly from the use of or reliance on the information provided on this website.
This website is not directed to residents of certain jurisdictions such as the United States, Singapore, Australia, China and some other specified regions, and is not intended for distribution to, or use by, any person in any countries or jurisdictions where such distribution or use would be contrary to local law or regulation.
This website is owned by Finzero Cap Ltd, a company incorporated in the Republic of Cyprus under registration number HE414308, with its registered office at 62 Athalassas, Mezzanine, Strovolos 2012, Nicosia, Cyprus. Finzero Cap Ltd serves as the authorized representative for PU Prime Ltd.
