Join the PU Xtrader Challenge Today
Trade with simulated capital and earn real profits after you pass our trader assessment.
Join the PU Xtrader Challenge Today
Trade with simulated capital and earn real profits after you pass our trader assessment.
27 February 2024,05:56
Daily Market AnalysisMarket Insights
27 February 2024, 05:56
* Upbeat Japan National Core CPI reading at 2% fuels the Yen’s strength.
* Signs of buying activity in refineries in the U.S. and China push oil prices higher.
*BTC prices surged to the highest level in 2 years, above $ 56,000.
The momentum behind the rally in U.S. equity markets is showing signs of moderation, with indices trading relatively flat as investors await the forthcoming U.S. Personal Consumption Expenditures (PCE) data. This key inflation indicator is critically observed for insights into the Federal Reserve’s future monetary policy moves, significantly influencing market risk appetite. Meanwhile, U.S. long-term Treasury yields have stabilised around the 4.3% level, reflecting a cautious stance among bond traders. Similarly, the Dollar Index (DXY) is experiencing subdued activity as market participants adjust their positions in anticipation of the PCE data release on Thursday.
In international markets, Japan’s latest Core Consumer Price Index (CPI) data, reporting a 2% increase, surpassed expectations and lent support to the Japanese Yen, bolstering its value against other major currencies. This uptick in inflation could prompt speculation about potential monetary policy adjustments by the Bank of Japan.
In the cryptocurrency sphere, Bitcoin (BTC) has surged to its highest level in two years, crossing the $56,000 mark. This rally was sparked by news that MicroStrategy, a prominent software company, has expanded its Bitcoin holdings by an additional 3,000 units. This significant purchase has fueled bullish sentiment in the cryptocurrency market, attracting increased buying interest in Bitcoin.
Current rate hike bets on 20th March Fed interest rate decision:
Source: CME Fedwatch Tool
0 bps (92%) VS -25 bps (8%)
(MT4 System Time)

Source: MQL5

The Dollar Index faces headwinds, experiencing a bearish trend due to lacklustre economic data, notably the disappointing US New Home Sales figure of 661K, falling short of the expected 680K. This unexpected result raises concerns among investors. Eyes are now keenly set on crucial economic indicators, with January’s release of the Personal Consumption Expenditures Price Index (PCE) taking centre stage as a critical metric for the Federal Reserve. The impending unveiling of US GDP data later in the week adds a layer of complexity to the evolving market narrative.
The Dollar Index is currently trading lower, testing a key support level. The Moving Average Convergence Divergence (MACD) indicates an increasing bearish momentum, while the Relative Strength Index (RSI) stands at 43, suggesting a likelihood of further losses, particularly after the RSI breached below the midline.
Resistance level: 104.50, 104.95
Support level: 103.85, 103.05
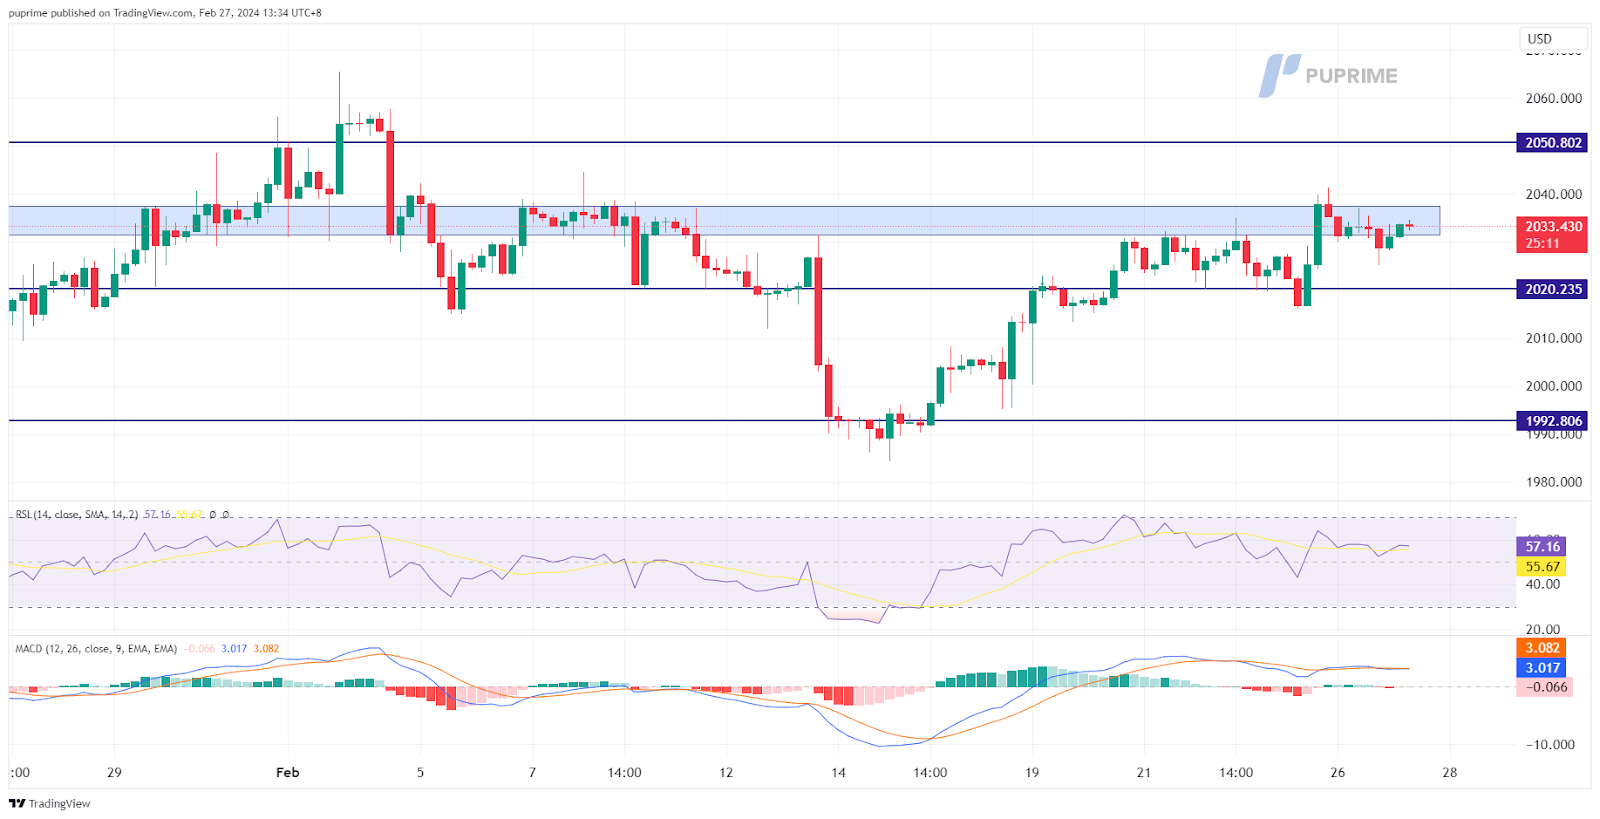
Gold prices have seen a modest uptick, benefiting from a softening US Dollar following disappointing home sales figures. This positive shift offers a glimmer of optimism, yet the short-term outlook for gold remains uncertain. Investors are treading carefully, with their attention riveted on forthcoming pivotal US economic data releases, including the GDP and Core PCE report, to gauge future market directions.
Gold is currently trading higher, touching upon a critical resistance level. The Moving Average Convergence Divergence (MACD) shows a reduction in bearish momentum, while the Relative Strength Index (RSI) at 56 indicates potential for further gains, especially as the RSI remains above the neutral 50 mark, suggesting that gold prices may continue to climb if they successfully breach the current resistance level.
Resistance level: 2035.00, 2060.00
Support level: 2015.00, 1985.0
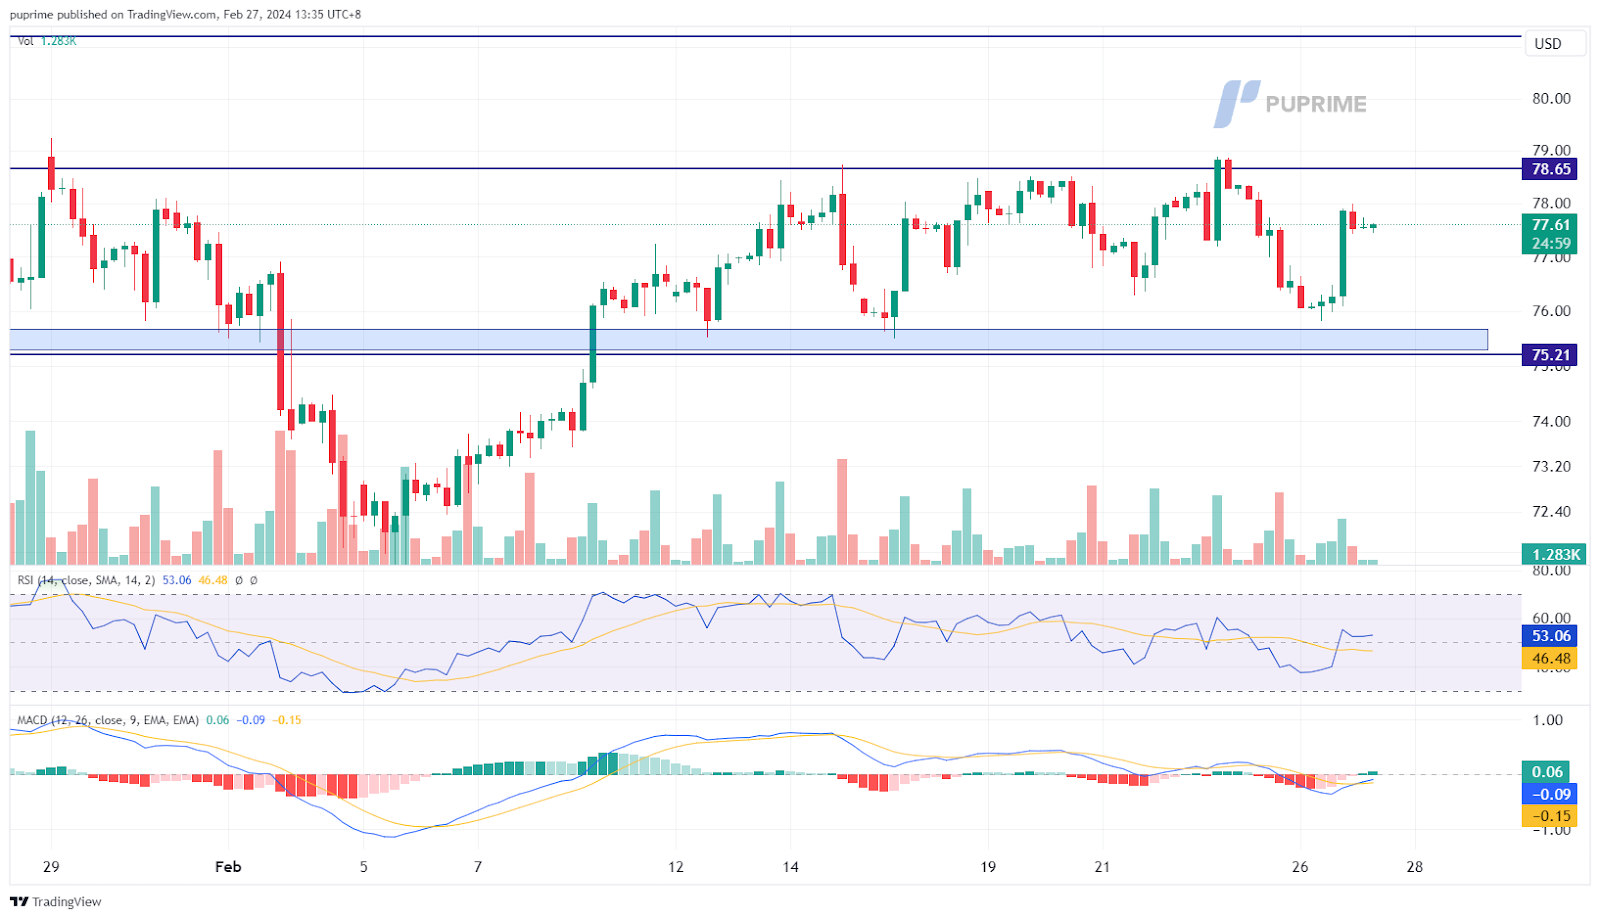
Oil prices have experienced a significant rebound, propelled by ongoing shipping disruptions, particularly in the Red Sea due to the actions of Iran-aligned Houthi rebels. The geopolitical strife in the Middle East continues to stoke concerns, casting a shadow of volatility over the oil markets. Despite efforts toward ceasefire talks, the absence of meaningful progress exacerbates fears of potential supply chain disruptions, exerting upward pressure on oil prices.
From a technical analysis perspective, oil is currently trading higher, having recently bounced back from a critical support level. The Moving Average Convergence Divergence (MACD) indicates a strengthening in bullish momentum, while the Relative Strength Index (RSI) at 53 suggests that oil prices may continue their upward trajectory following the breakout, as the RSI remains above the neutral threshold.
Resistance level: 78.65, 81.20
Support level: 75.20, 71.35

Trade with simulated capital and earn real profits after you pass our trader assessment.

20 May 2025, 06:46 Gold Slips as Ceasefire Hopes Curb Safe-Haven Demand

7 May 2025, 03:59 Geopolitical Risks and FOMC Uncertainty Shake Global Markets

6 May 2025, 05:53 Dollar Dips, Gold Rallies on U.S.-Taiwan Risk


New Registrations Unavailable
We’re not accepting new registrations at the moment.
While new sign ups are unavailable, existing users can continue their challenges and trading activities as usual.
Disclaimer: This website exclusively provides proprietary trading services. We do not engage in any regulated activities, offer investment management services, or manage funds on behalf of external clients. Our trading activities are conducted solely with the firm's own capital, and we do not accept client deposits or manage client accounts. It's important to note that none of the services we provide should be construed as investment or financial services in accordance with applicable laws.
This website offers services related to professional skill and experience assessment, which determine your eligibility to trade with the firm's capital. The outcome of these services is inherently determined by your individual skill level and ability to perform within the trading requirements and objectives outlined for each service separately. Clients are strongly advised to thoroughly understand the requirements of the services before signing up for any.
The content provided on this website is for informational purposes only and does not constitute financial, investment, or trading advice. The information presented is based on sources believed to be reliable, but we do not guarantee its accuracy, completeness, or timeliness. We disclaim any liability for any loss or damage arising directly or indirectly from the use of or reliance on the information provided on this website.
This website is not directed to residents of certain jurisdictions such as the United States, Singapore, Australia, China and some other specified regions, and is not intended for distribution to, or use by, any person in any countries or jurisdictions where such distribution or use would be contrary to local law or regulation.
This website is owned by Finzero Cap Ltd, a company incorporated in the Republic of Cyprus under registration number HE414308, with its registered office at 62 Athalassas, Mezzanine, Strovolos 2012, Nicosia, Cyprus. Finzero Cap Ltd serves as the authorized representative for PU Prime Ltd.
