Join the PU Xtrader Challenge Today
Trade with simulated capital and earn real profits after you pass our trader assessment.
Join the PU Xtrader Challenge Today
Trade with simulated capital and earn real profits after you pass our trader assessment.
21 February 2024,05:53
Daily Market AnalysisMarket Insights
21 February 2024, 05:53
* Australia’s annual wage growth hits a 15-year high, boosting the Australian dollar.
* Russia met the export cut target in January, providing buoyancy for oil prices.
*All eyes are on the FOMC January meeting minutes today to gauge the strength of the U.S. dollar.
Approaching the Federal Open Market Committee (FOMC) January meeting minutes, the Dollar Index (DXY) is encountering headwinds, struggling to sustain its value above $104. Concurrently, gold prices are experiencing a notable surge, breaching the formidable resistance level at $2020, propelled by the softened dollar. Heightened tensions in the Red Sea, where Houthi militants compelled a vessel’s crew to abandon ship, underscore persistent risks in the region, further bolstering gold’s status as a safe-haven asset. This geopolitical situation may also impact oil prices. Adding to these dynamics, the latest OPEC+ report indicates Russia’s adherence to its January export cut target, aligning with the cartel’s early pledges and thereby supporting oil prices.
In the equity realm, all major U.S. indexes have tapered off, with Nvidia leading the descent with a 4.35% decline. The impending earnings report from the chip-making giant, expected later today, is poised to exert considerable influence on the equity market. Meanwhile, Australia’s Q4 wage growth has met market expectations at 0.9%, propelling annual wage growth to a 15-year high due to the country’s low unemployment rates and intense labor market competition. This robust employment scenario may prompt the Reserve Bank of Australia (RBA) to exercise heightened caution in its monetary policy decisions, potentially contributing to the strength of the Australian dollar.
Current rate hike bets on 20th March Fed interest rate decision:
Source: CME Fedwatch Tool
0 bps (92%) VS -25 bps (8%)
(MT4 System Time)
Source: MQL5

The US Dollar underwent a pullback as investors engaged in profit-taking maneuvers ahead of the imminent release of the Federal Open Market Committee (FOMC) meeting minutes. The focus is now intensely on gleanings from the late-January meeting, where the central bank’s decision to uphold interest rates and concerns surrounding lingering inflation laid the groundwork for potential market reverberations. The forthcoming nuanced discussions and comments from Federal Reserve members are positioned to command the spotlight, significantly influencing global investor sentiment.
The Dollar Index is trading lower, probing a key support level. Yet, it’s noteworthy that the MACD has indicated a diminishing bearish momentum, and the RSI stands at 39. This suggests a potential technical correction for the index, particularly considering the RSI’s sharp rebound from oversold territory.
Resistance level: 104.60, 105.70
Support level: 103.80, 103.00
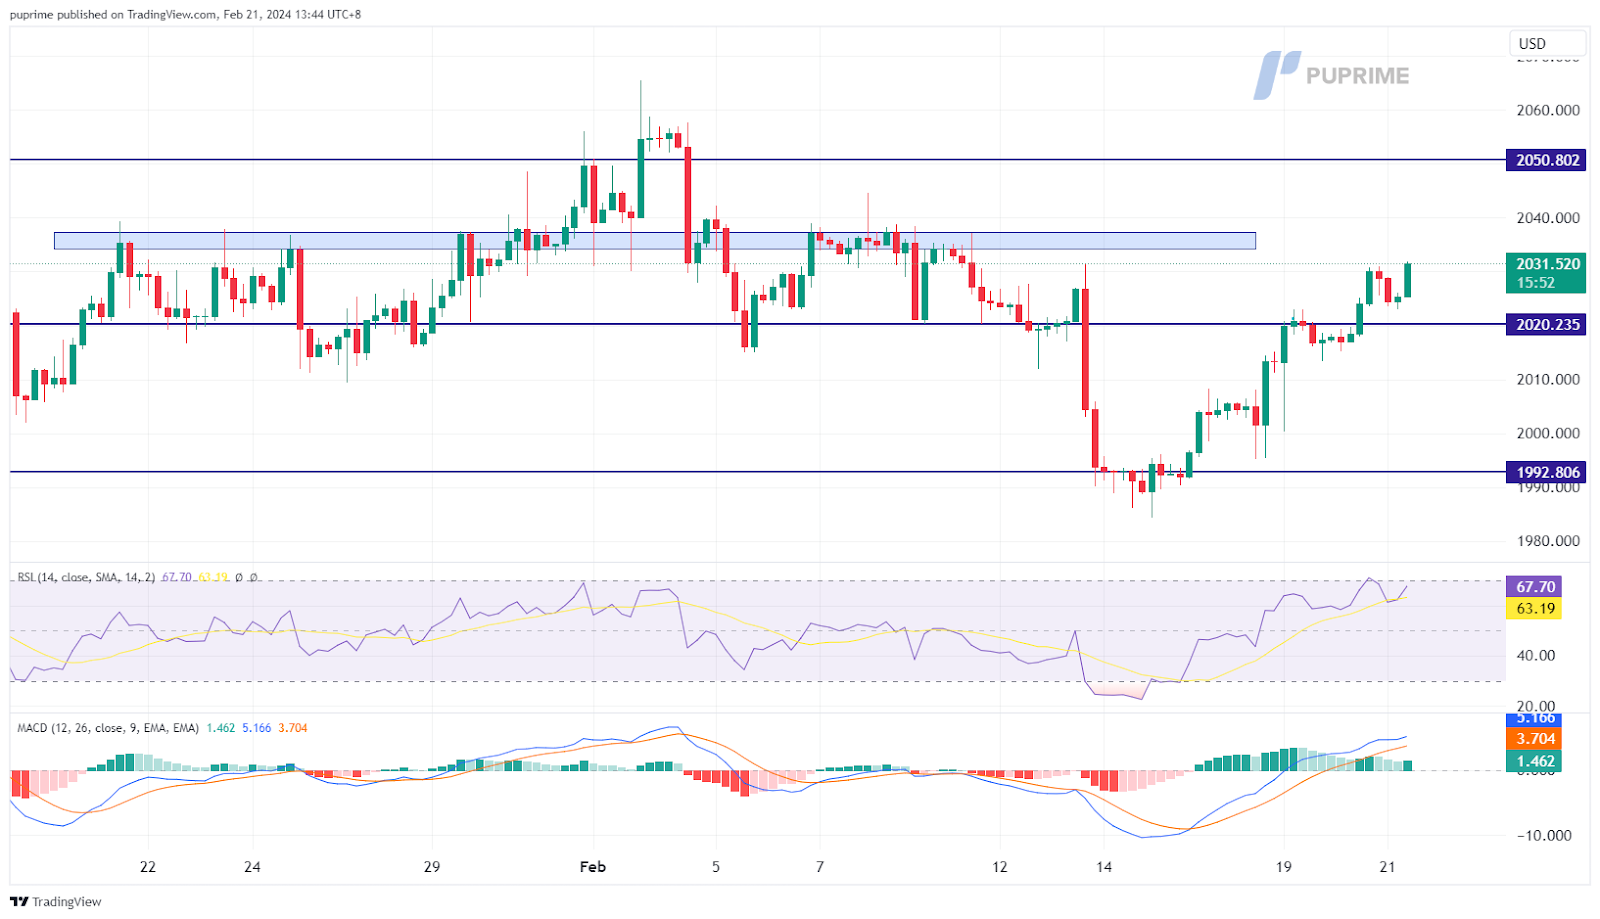
Gold prices are holding steady near the psychological threshold of $2025 as global investors exercise caution, awaiting insights from the FOMC meeting minutes before making definitive moves in the gold market. Despite apprehensions regarding prolonged elevated US interest rates, gold showcased resilience by rebounding after testing the critical support level of $2000. The overall trajectory for gold remains intricate, with escalating geopolitical tensions in the Middle East lending support due to heightened safe-haven demand. Simultaneously, the anticipation of a hawkish stance from the Federal Reserve is casting a shadow over the attractiveness of dollar-denominated gold.
Gold prices exhibit an upward movement subsequent to the breakout above the resistance level. However, it’s crucial to note that the Moving Average Convergence Divergence (MACD) has hinted at diminishing bullish momentum, and the Relative Strength Index (RSI) is positioned at 62. This implies the potential for a technical correction in the commodity, particularly considering the RSI’s marked retreat from overbought territory.
Resistance level: 2035.00, 2060.00
Support level: 2015.00, 1985.00
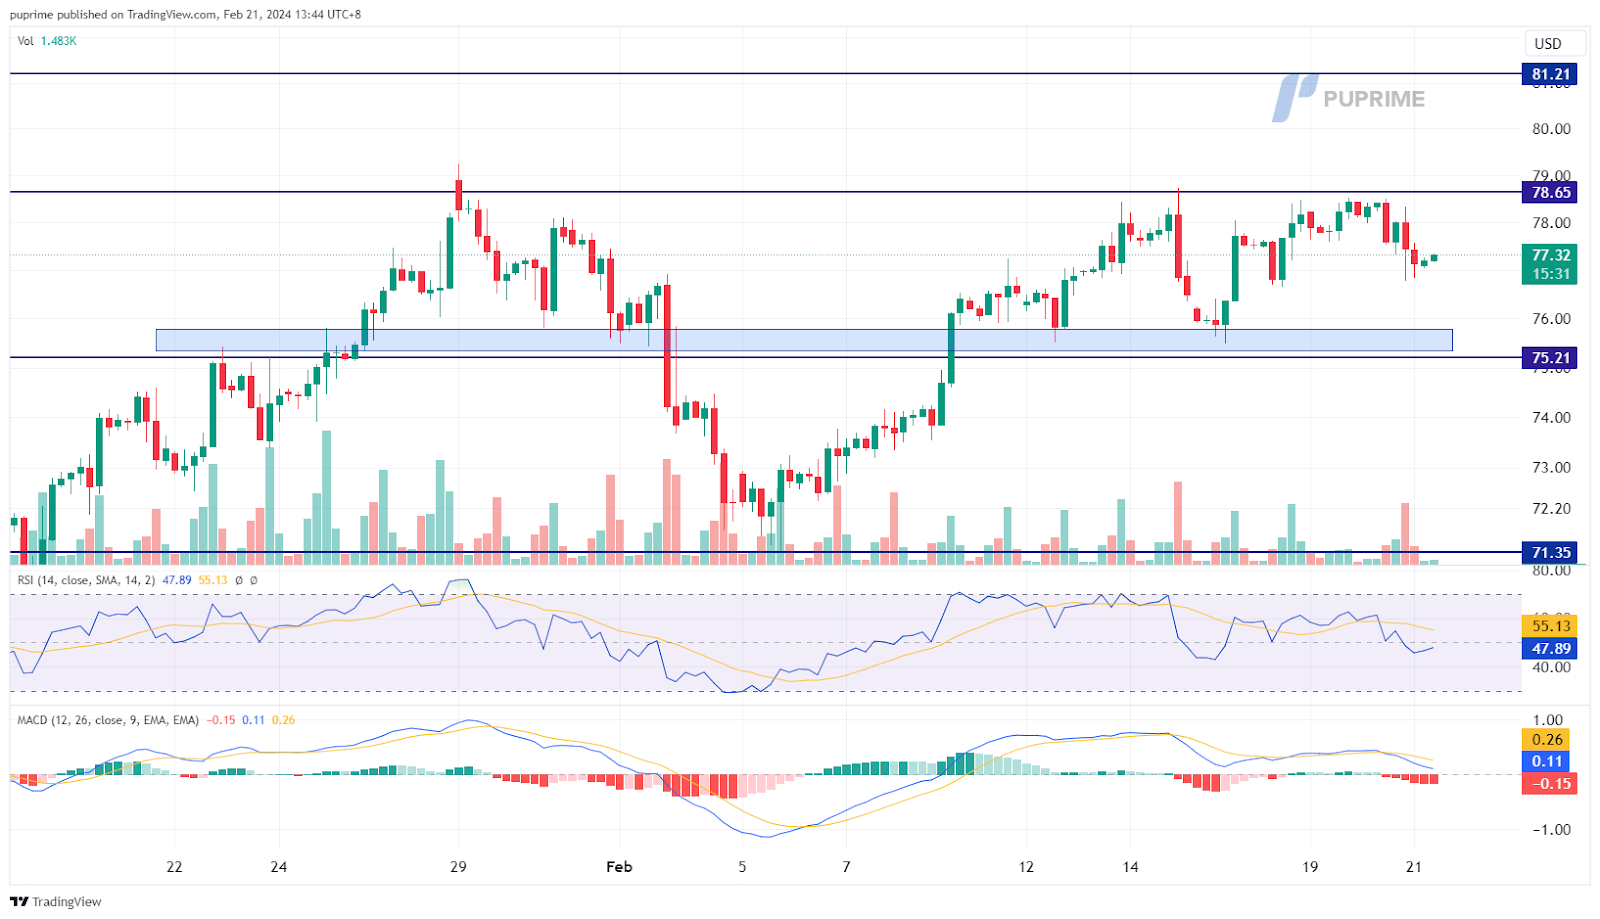
Crude oil prices underwent a retracement, encountering resistance and refraining from surpassing a formidable level, largely ascribed to a technical correction in the market. Persistent geopolitical uncertainties, particularly the unresolved ceasefire between Hamas and Israel, add to concerns regarding potential disruptions in the oil supply chain. Conversely, the recent rate cut by the Chinese central bank aims to invigorate economic momentum, with potential implications for increased oil demand should the positive economic trajectory be sustained.
Oil prices are trading lower subsequent to the earlier retracement from the resistance level. The Moving Average Convergence Divergence (MACD) has indicated a rise in bearish momentum, and the Relative Strength Index (RSI) is positioned at 47. This suggests the possibility of the commodity extending its losses, particularly as the RSI remains below the midline
Resistance level: 78.65, 81.20
Support level:75.20, 71.35

Trade with simulated capital and earn real profits after you pass our trader assessment.

20 May 2025, 06:46 Gold Slips as Ceasefire Hopes Curb Safe-Haven Demand

7 May 2025, 03:59 Geopolitical Risks and FOMC Uncertainty Shake Global Markets

6 May 2025, 05:53 Dollar Dips, Gold Rallies on U.S.-Taiwan Risk


New Registrations Unavailable
We’re not accepting new registrations at the moment.
While new sign ups are unavailable, existing users can continue their challenges and trading activities as usual.
Disclaimer: This website exclusively provides proprietary trading services. We do not engage in any regulated activities, offer investment management services, or manage funds on behalf of external clients. Our trading activities are conducted solely with the firm's own capital, and we do not accept client deposits or manage client accounts. It's important to note that none of the services we provide should be construed as investment or financial services in accordance with applicable laws.
This website offers services related to professional skill and experience assessment, which determine your eligibility to trade with the firm's capital. The outcome of these services is inherently determined by your individual skill level and ability to perform within the trading requirements and objectives outlined for each service separately. Clients are strongly advised to thoroughly understand the requirements of the services before signing up for any.
The content provided on this website is for informational purposes only and does not constitute financial, investment, or trading advice. The information presented is based on sources believed to be reliable, but we do not guarantee its accuracy, completeness, or timeliness. We disclaim any liability for any loss or damage arising directly or indirectly from the use of or reliance on the information provided on this website.
This website is not directed to residents of certain jurisdictions such as the United States, Singapore, Australia, China and some other specified regions, and is not intended for distribution to, or use by, any person in any countries or jurisdictions where such distribution or use would be contrary to local law or regulation.
This website is owned by Finzero Cap Ltd, a company incorporated in the Republic of Cyprus under registration number HE414308, with its registered office at 62 Athalassas, Mezzanine, Strovolos 2012, Nicosia, Cyprus. Finzero Cap Ltd serves as the authorized representative for PU Prime Ltd.
