Join the PU Xtrader Challenge Today
Trade with simulated capital and earn real profits after you pass our trader assessment.
Join the PU Xtrader Challenge Today
Trade with simulated capital and earn real profits after you pass our trader assessment.
7 March 2024,05:56
Daily Market AnalysisMarket Insights
7 March 2024, 05:56
* The dollar index traded to its one-month low after a Dovish Testimony by Jerome Powell.
* The soft dollar has pushed the gold to break its all-time high levels with strong bullish momentum in sight.
* BTC rebounded and is back to $67000 territory.
The Powell testimony that began yesterday brought an unexpected statement from the Fed’s chief, putting pressure on the dollar. Powell signalled the likelihood of the U.S. central bank cutting rates this year, although without specifying when and by how much. Consequently, the dollar index plummeted nearly 0.5%, reaching its lowest levels in a month. This shift in the currency market influenced commodities positively, with gold prices hitting an all-time high above $2150, while oil prices rebounded, supported by favorable U.S. crude oil data as well. Additionally, insight from the largest Japanese bank, positioning itself for a potential BoJ monetary policy shift in March, led to a robust Japanese Yen, resulting in a nearly 0.8% drop in the USD/JPY pair.
Current rate hike bets on 20th March Fed interest rate decision:
Source: CME Fedwatch Tool
0 bps (95%) VS -25 bps (5%)
(MT4 System Time)

Source: MQL5
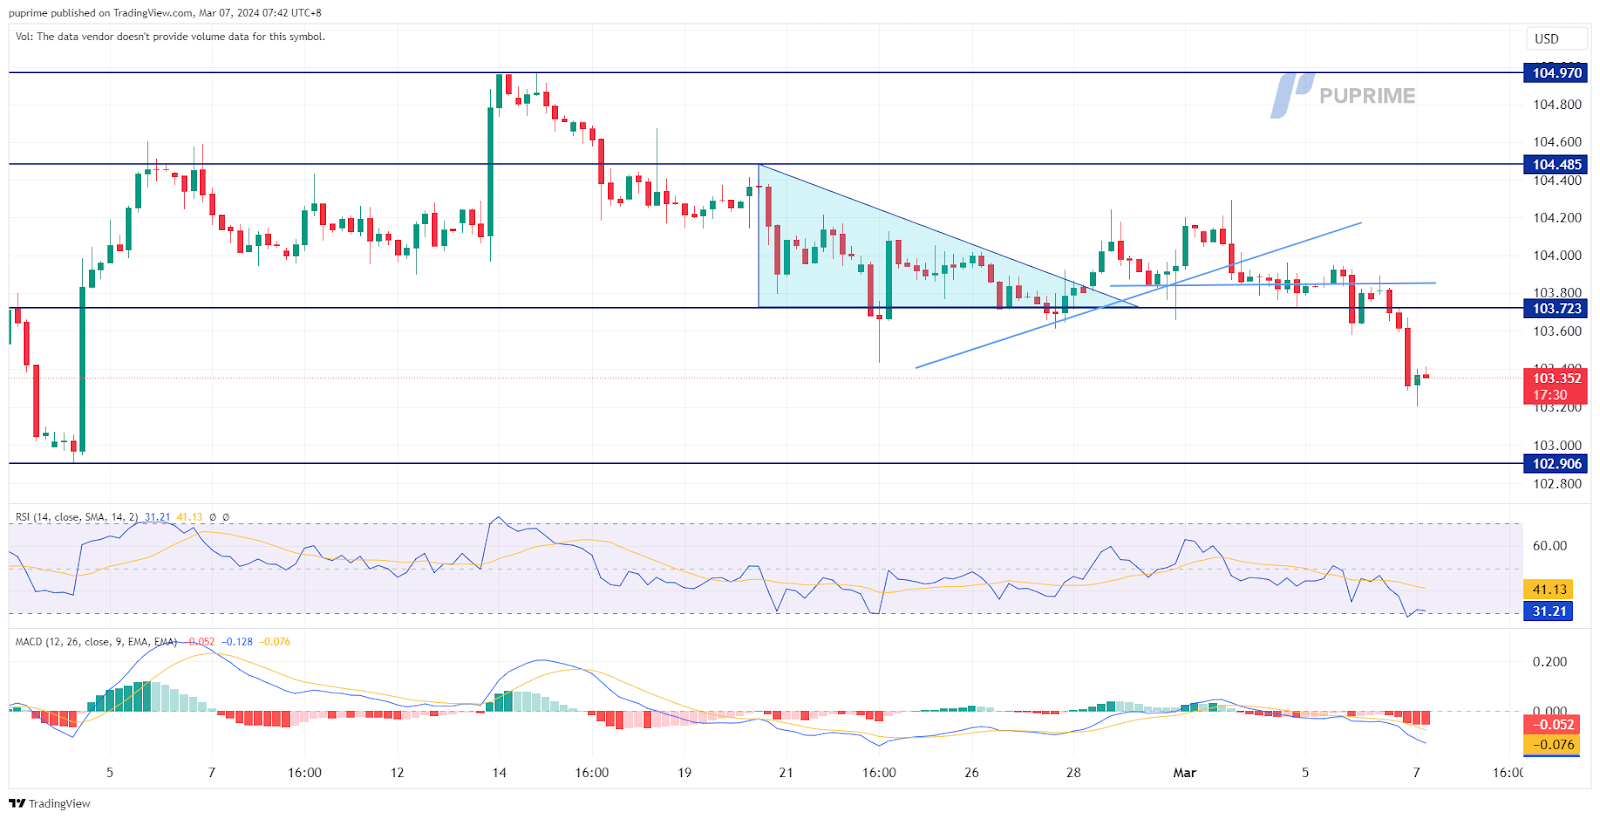
The Dollar Index has descended to its lowest point in a month, currently trading below 103.50 levels. The dollar faced significant downward pressure primarily due to the dovish stance communicated in Powell’s testimony that began yesterday. Powell indicated an expectation that the U.S. central bank will initiate rate cuts this year. Traders are closely monitoring the upcoming Non-Farm Payrolls (NFP) report scheduled for Friday, as it may offer insights into the potential timing of the Federal Reserve’s rate-cutting actions.
The dollar index traded eased from its crucial liquidity zone and plunged to its one-month high, suggesting a bearish bias for the dollar. The Relative Strength Index (RSI) is on the brink of breaking into the oversold zone, while the Moving Average Convergence Divergence (MACD) continues to decline and diverge, suggesting that bearish momentum is gaining.
Resistance levels: 103.70, 104.50
Support levels: 102.90, 102.00
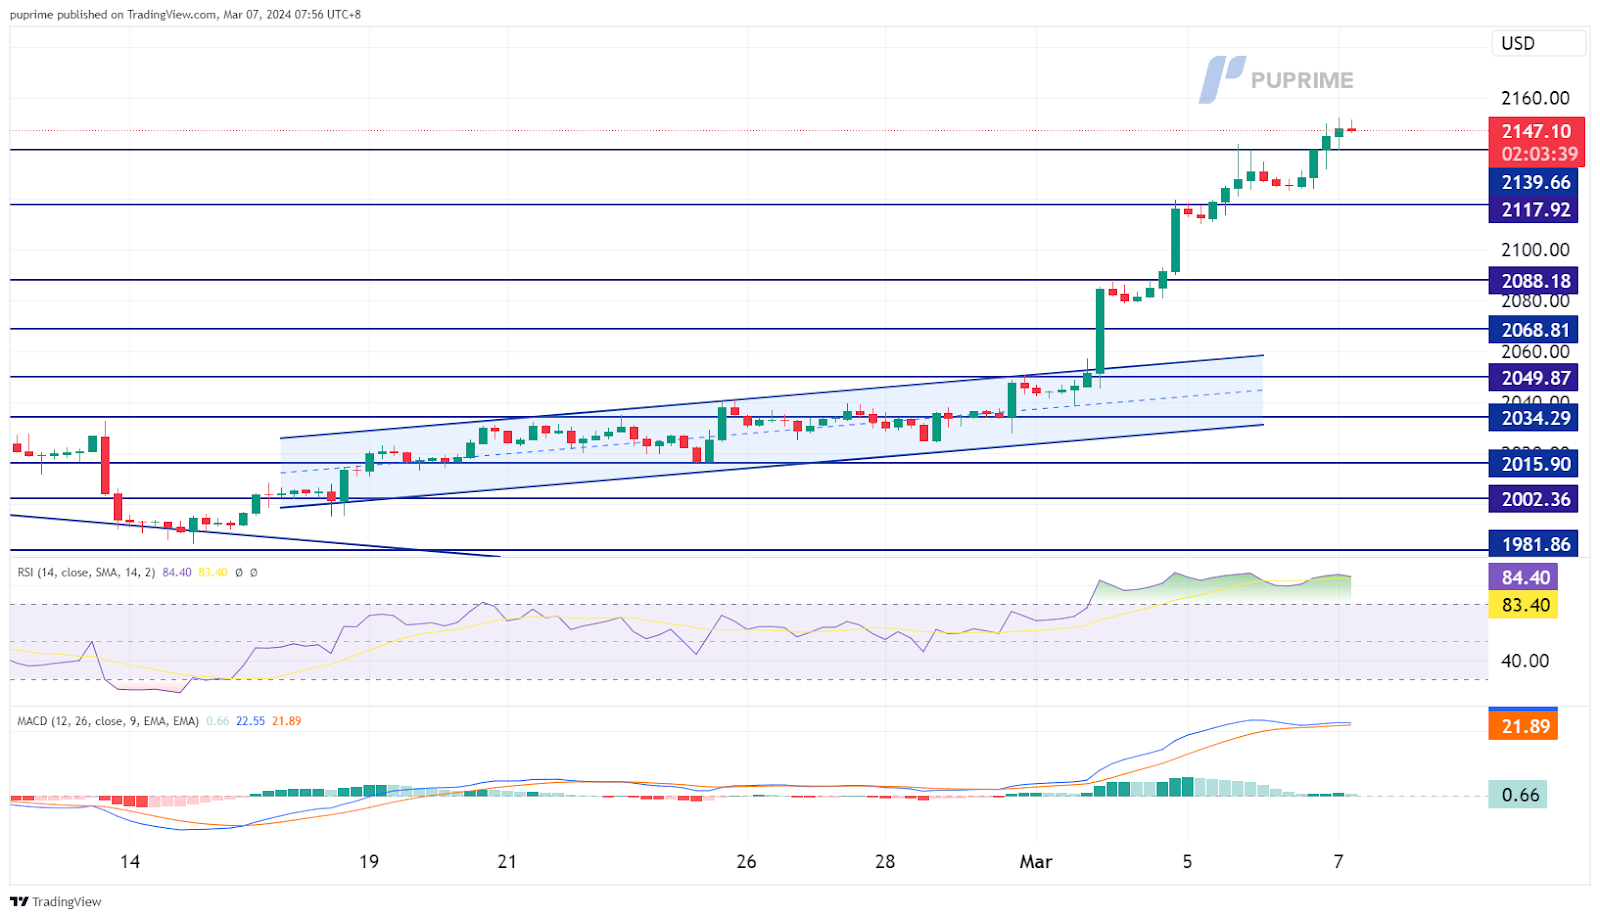
Gold prices have surged to their all-time high levels and are currently testing the possibility of breaking above this threshold. The bullish momentum observed in gold throughout March can be attributed to the market sentiment indicating that the Federal Reserve may be considering a pivot from its current monetary policy. Simultaneously, the Bank of Japan (BoJ) is also potentially contemplating a shift in its monetary policy, raising concerns about a reduction in global liquidity. In such an environment, gold emerges as a favored safe-haven asset for investors looking to position themselves amidst uncertainties in central bank policies.
Gold prices have risen and are attempting to break beyond their all-time highs. The Relative Strength Index (RSI) remains flowing in the overbought zone, while the Moving Average Convergence Divergence (MACD) remains at an elevated level, suggesting that the bullish momentum remains strong.
Resistance levels: 2155.00, 2170.00
Support levels: 2140.00, 2117.90
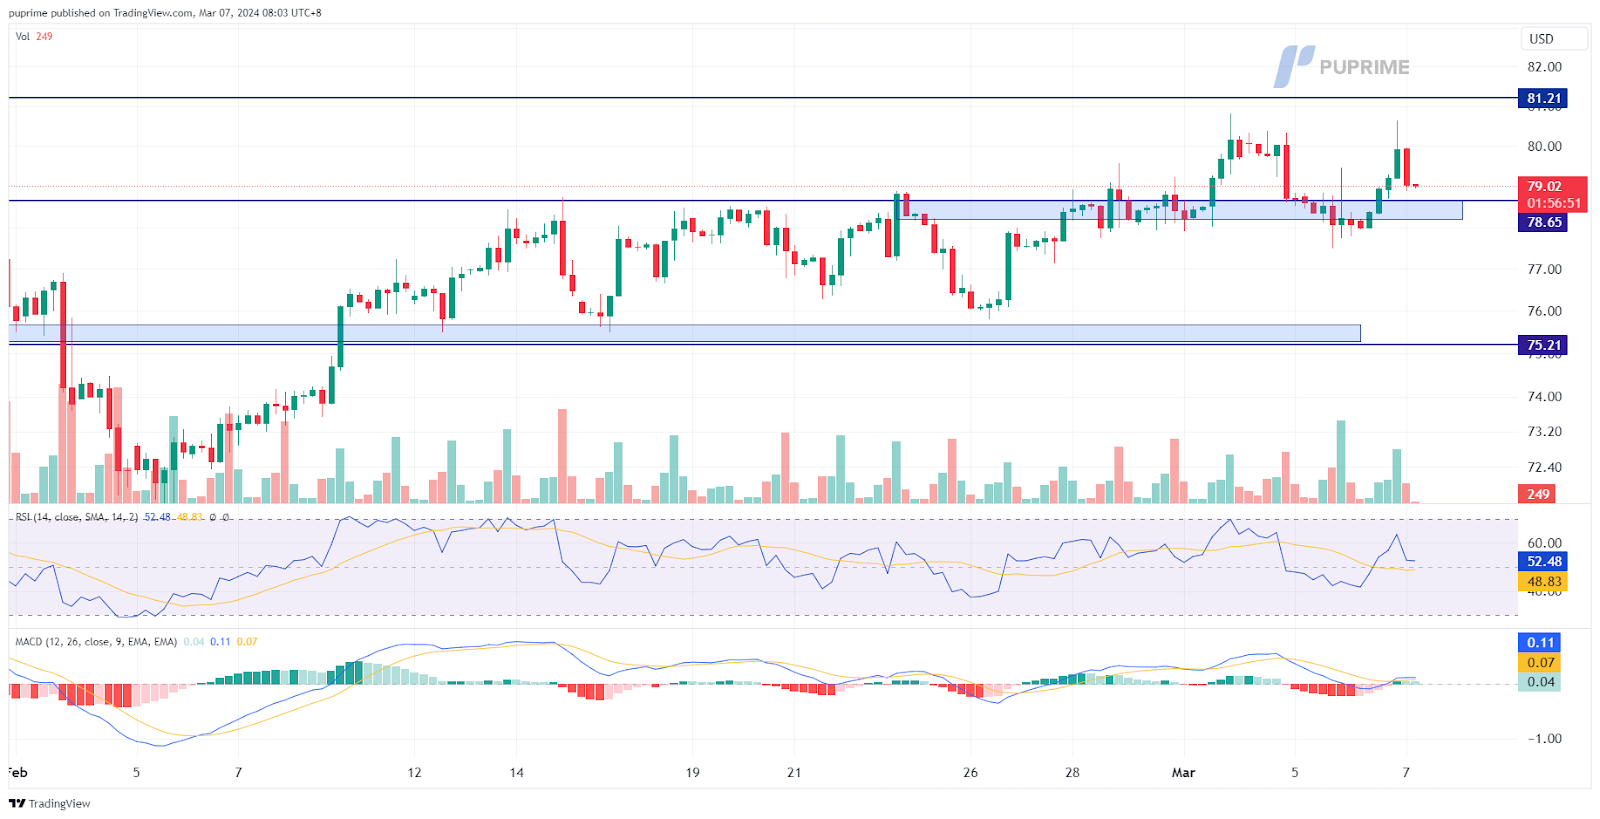
Oil prices have rebounded from their liquidity zone and maintained their previous high levels, forming a double top price pattern. The dovish stance from the Fed’s testimony has provided support for higher oil prices. Additionally, the weekly U.S. oil reports falling short of expectations suggest an improvement in oil demand in the U.S., contributing to the positive momentum in the oil market.
Oil prices have rebounded but formed a double-top price pattern, suggesting a potential trend reversal for oil prices. The Relative Strength Index (RSI) has been flowing in the upper territory while the Moving Average Convergence Divergence (MACD) hovering close to the zero line suggests the oil prices remain trading with bullish momentum.
Resistance levels: 81.20, 84.10
Support levels: 78.65, 75.20

Trade with simulated capital and earn real profits after you pass our trader assessment.

20 May 2025, 06:46 Gold Slips as Ceasefire Hopes Curb Safe-Haven Demand

7 May 2025, 03:59 Geopolitical Risks and FOMC Uncertainty Shake Global Markets

6 May 2025, 05:53 Dollar Dips, Gold Rallies on U.S.-Taiwan Risk


New Registrations Unavailable
We’re not accepting new registrations at the moment.
While new sign ups are unavailable, existing users can continue their challenges and trading activities as usual.
Disclaimer: This website exclusively provides proprietary trading services. We do not engage in any regulated activities, offer investment management services, or manage funds on behalf of external clients. Our trading activities are conducted solely with the firm's own capital, and we do not accept client deposits or manage client accounts. It's important to note that none of the services we provide should be construed as investment or financial services in accordance with applicable laws.
This website offers services related to professional skill and experience assessment, which determine your eligibility to trade with the firm's capital. The outcome of these services is inherently determined by your individual skill level and ability to perform within the trading requirements and objectives outlined for each service separately. Clients are strongly advised to thoroughly understand the requirements of the services before signing up for any.
The content provided on this website is for informational purposes only and does not constitute financial, investment, or trading advice. The information presented is based on sources believed to be reliable, but we do not guarantee its accuracy, completeness, or timeliness. We disclaim any liability for any loss or damage arising directly or indirectly from the use of or reliance on the information provided on this website.
This website is not directed to residents of certain jurisdictions such as the United States, Singapore, Australia, China and some other specified regions, and is not intended for distribution to, or use by, any person in any countries or jurisdictions where such distribution or use would be contrary to local law or regulation.
This website is owned by Finzero Cap Ltd, a company incorporated in the Republic of Cyprus under registration number HE414308, with its registered office at 62 Athalassas, Mezzanine, Strovolos 2012, Nicosia, Cyprus. Finzero Cap Ltd serves as the authorized representative for PU Prime Ltd.
