Join the PU Xtrader Challenge Today
Trade with simulated capital and earn real profits after you pass our trader assessment.
Join the PU Xtrader Challenge Today
Trade with simulated capital and earn real profits after you pass our trader assessment.
4 March 2024,07:37
Daily Market AnalysisMarket Insights
4 March 2024, 07:37
* Poor ISM PMI readings put pressure on dollar strength.
* Traders’ eyes on Tokyo Core CPI due tomorrow to gauge the Yen’s strength.
* OPEC+ will extend oil supply cuts to the second quarter of 2024 to avert a global surplus.
The recent release of ISM PMI readings, which fell short of market expectations, triggered a significant decline in the strength of the dollar. This downturn in the dollar spurred an improvement in risk appetite, propelling U.S. equity markets to reach record highs. Commodity prices, including gold, surged to their highest levels since last November, benefiting from the softer dollar environment. Furthermore, the decision by OPEC+ to extend its oil supply cuts into the second quarter of 2024 provided additional support to oil prices.
In the cryptocurrency arena, anticipation surrounding the upcoming Bitcoin halving event, which reduces the reward for miners and potentially decreases BTC supply, has set Bitcoin prices on a trajectory towards its all-time high of $68,986. This event underscores the intricate dynamics between supply mechanisms and market valuations in the digital asset space.
Current rate hike bets on 20th March Fed interest rate decision:
Source: CME Fedwatch Tool
0 bps (95%) VS -25 bps (5%)
(MT4 System Time)
N/A
Source: MQL5
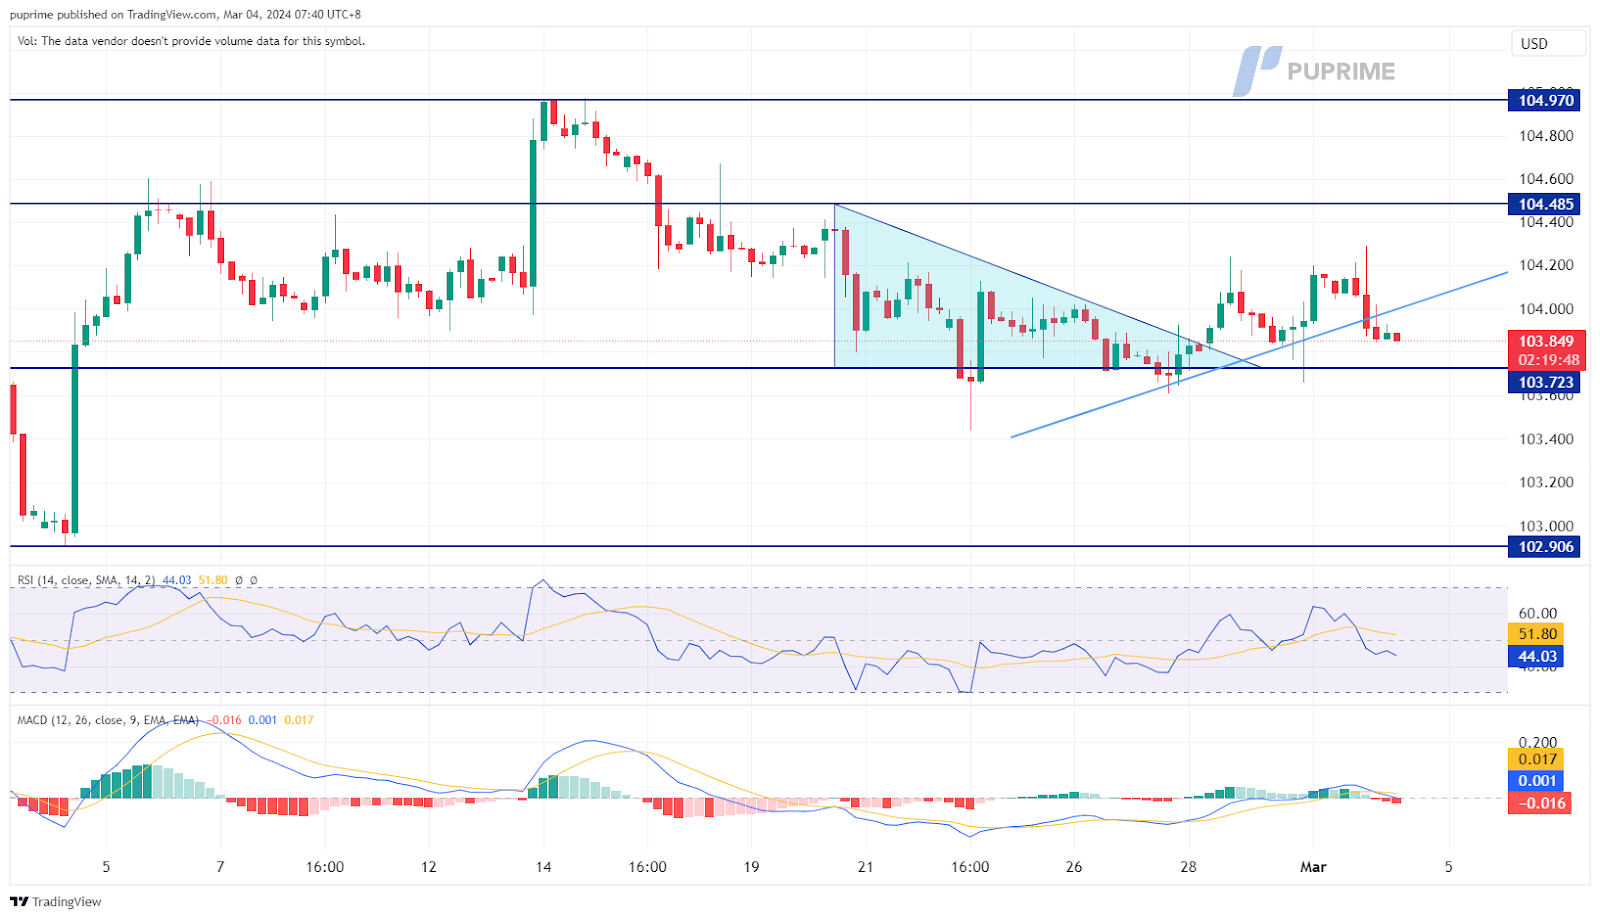
The Dollar Index experienced a decline last Friday, driven by a shift in the market’s risk sentiment. Discouraging ISM manufacturing PMI readings weighed on the dollar, leading investors to sell the currency and redirect their focus towards riskier assets. In the upcoming week, several Federal Reserve members are scheduled to deliver speeches, with these addresses expected to offer insights into potential monetary moves by the Fed, influencing the trajectory of the dollar’s strength.
Despite the decline, the Dollar Index has found support near 103.85, indicating that the bullish trend remains intact. The Relative Strength Index (RSI) continues to hover near the 50 levels, while the Moving Average Convergence Divergence (MACD) is positioned between the zero line, providing a neutral signal for the dollar index.
Resistance level: 104.50, 104.95
Support level: 103.70, 102.90
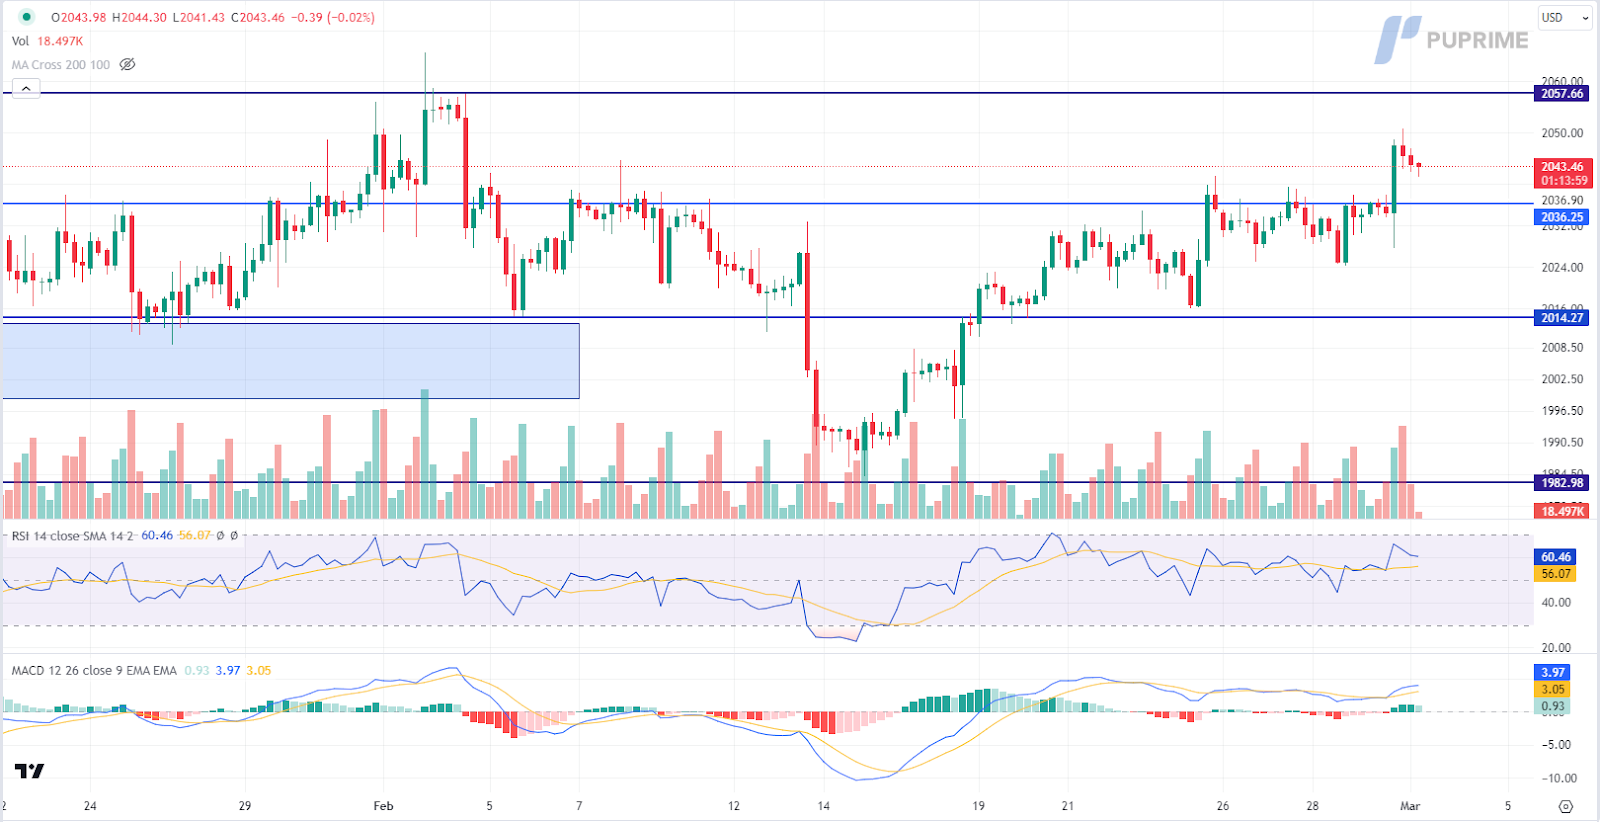
Gold prices witnessed a significant surge, reaching their highest level since December. The weakened dollar, influenced by the latest PCE reading aligning with market expectations and lower than the previous figure, contributed to the bullish momentum in gold. Investors closely monitored the ongoing ceasefire talks in Cairo, Egypt, amidst escalating tensions in the Middle East, adding an additional layer of complexity to the precious metal’s movements.
Gold prices have broken above the uptrend channel and gained an early 2% in the last session, indicating a strong bullish momentum. The Relative Strength Index (RSI) has entered the overbought zone, while the Moving Average Convergence Divergence (MACD) rebounded from above the zero line, suggesting robust bullish momentum.
Resistance levels: 2088.00, 2118.00
Support levels: 2068.80, 2049.90
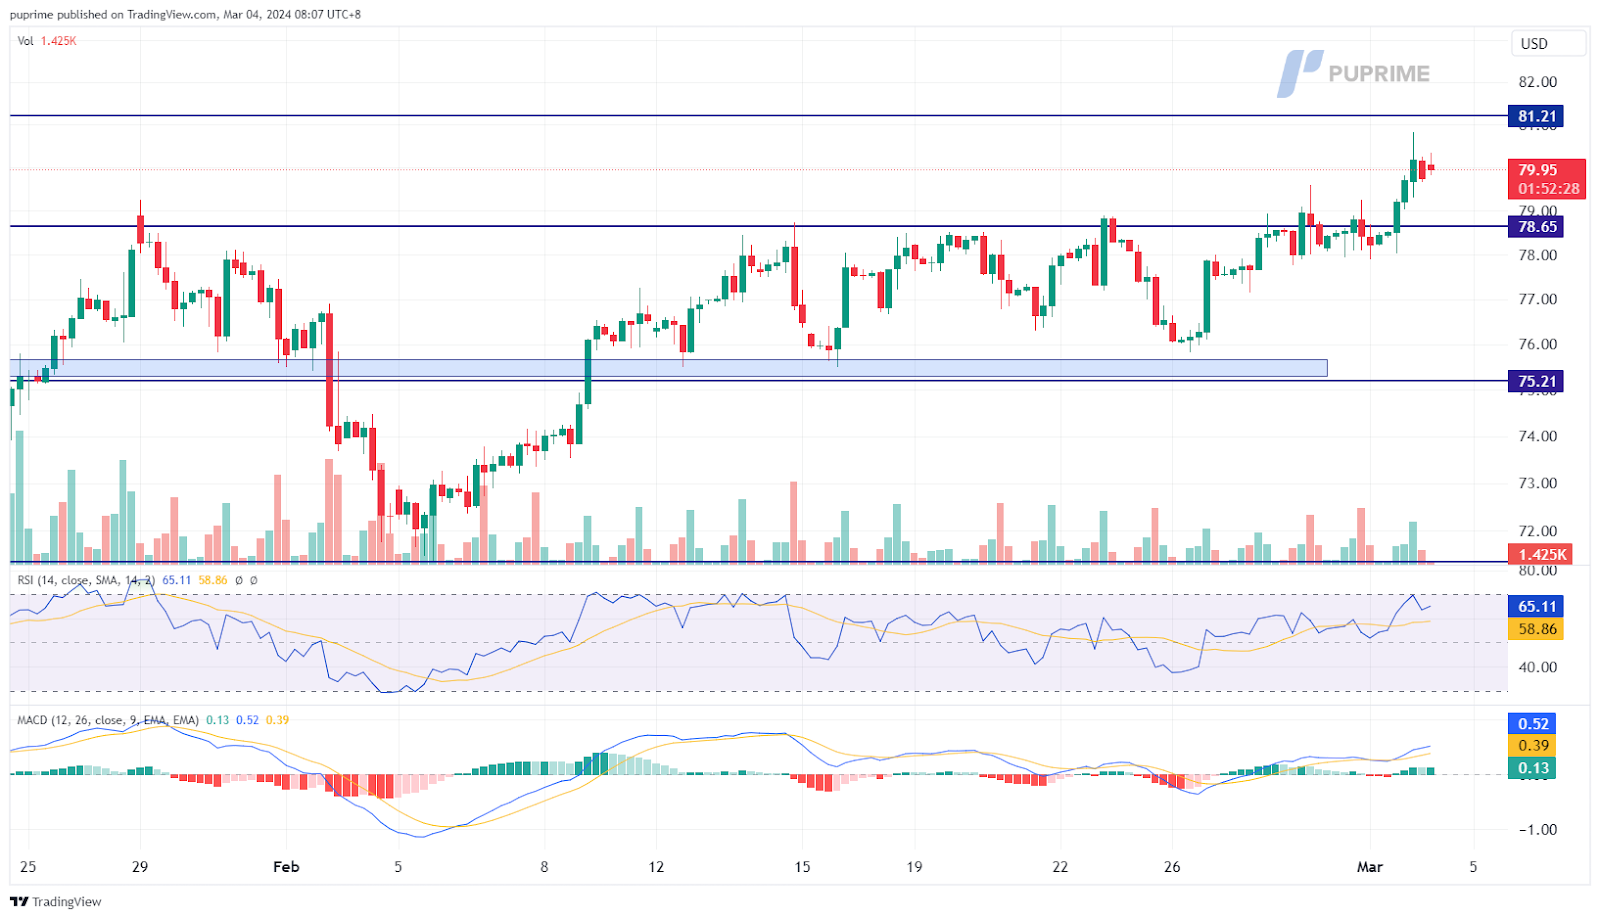
Oil prices have surged beyond a significant resistance level at 78.65, indicating a robust bullish trend. The upward trajectory is primarily attributed to OPEC+’s strategic decision to extend its supply reduction by 2.2 million barrels per day into the second quarter of 2024, highlighting the cartel’s commitment to stabilising the market and bolstering oil prices.
Oil prices have successfully broken through a formidable resistance level that has been holding since last November. The Relative Strength Index (RSI) is approaching the overbought zone, while the Moving Average Convergence Divergence (MACD) shows signs of rebounding from the zero line, indicating the formation of a bullish momentum.
Resistance levels: 81.20, 84.10
Support levels: 78.65, 75.20

Trade with simulated capital and earn real profits after you pass our trader assessment.

20 May 2025, 06:46 Gold Slips as Ceasefire Hopes Curb Safe-Haven Demand

7 May 2025, 03:59 Geopolitical Risks and FOMC Uncertainty Shake Global Markets

6 May 2025, 05:53 Dollar Dips, Gold Rallies on U.S.-Taiwan Risk


New Registrations Unavailable
We’re not accepting new registrations at the moment.
While new sign ups are unavailable, existing users can continue their challenges and trading activities as usual.
Disclaimer: This website exclusively provides proprietary trading services. We do not engage in any regulated activities, offer investment management services, or manage funds on behalf of external clients. Our trading activities are conducted solely with the firm's own capital, and we do not accept client deposits or manage client accounts. It's important to note that none of the services we provide should be construed as investment or financial services in accordance with applicable laws.
This website offers services related to professional skill and experience assessment, which determine your eligibility to trade with the firm's capital. The outcome of these services is inherently determined by your individual skill level and ability to perform within the trading requirements and objectives outlined for each service separately. Clients are strongly advised to thoroughly understand the requirements of the services before signing up for any.
The content provided on this website is for informational purposes only and does not constitute financial, investment, or trading advice. The information presented is based on sources believed to be reliable, but we do not guarantee its accuracy, completeness, or timeliness. We disclaim any liability for any loss or damage arising directly or indirectly from the use of or reliance on the information provided on this website.
This website is not directed to residents of certain jurisdictions such as the United States, Singapore, Australia, China and some other specified regions, and is not intended for distribution to, or use by, any person in any countries or jurisdictions where such distribution or use would be contrary to local law or regulation.
This website is owned by Finzero Cap Ltd, a company incorporated in the Republic of Cyprus under registration number HE414308, with its registered office at 62 Athalassas, Mezzanine, Strovolos 2012, Nicosia, Cyprus. Finzero Cap Ltd serves as the authorized representative for PU Prime Ltd.
