Join the PU Xtrader Challenge Today
Trade with simulated capital and earn real profits after you pass our trader assessment.
Join the PU Xtrader Challenge Today
Trade with simulated capital and earn real profits after you pass our trader assessment.
9 February 2024,01:51
Daily Market AnalysisMarket Insights
9 February 2024, 01:51
Crude oil prices experienced a notable ascent of over 3% in the preceding trading session, primarily attributed to the deepening geopolitical tensions in the Middle East. The trajectory of ceasefire negotiations took a pessimistic turn as Israeli Prime Minister Benjamin Netanyahu rejected the proposed Gaza deal, characterising it as “delusional.” This heightened geopolitical uncertainty in the Middle East concurrently stimulated an increased demand for the safe-haven asset, gold.
Concurrently, the U.S. dollar exhibited resilience, maintaining its strength above the $104 threshold. This robust performance is underpinned by a steadfast economic trajectory in the United States, coupled with unwaveringly hawkish statements from various Federal Reserve officials.
In parallel, Bitcoin (BTC) exhibited notable strength, surpassing the $45,000 mark for the first time subsequent to the Securities and Exchange Commission’s approval of the BTC Exchange Traded Fund (ETF). The initial market sentiment, characterised by a “sell on news” approach, gradually dissipated. Notably, the demand for BlackRock and Fidelity ETFs played a pivotal role in fortifying the position of the largest cryptocurrency.
Current rate hike bets on 20th March Fed interest rate decision:
Source: CME Fedwatch Tool
0 bps (81%) VS -25 bps (19%)
(MT4 System Time)
Source: MQL5

The Dollar Index has retained its position above the pivotal 104 level, indicative of sustained bullish momentum. Heightened speculation regarding the Federal Reserve’s potential commitment to prolonged elevated interest rates as a measure to counteract inflation has driven a shift in market sentiment, propelling the dollar to higher echelons in the recent trading session.
As of the latest assessment, the Dollar Index continues to trade along trajectories surpassing the 104 level, underscoring an enduring bullish bias. The Relative Strength Index (RSI) maintains its position in the upper region, indicating the prevailing strength of the bullish trend. Meanwhile, the Moving Average Convergence Divergence (MACD) exhibits a slight descent but teeters on the cusp of crossing before descending below the zero line, hinting at the potential formation of a bullish momentum. These technical indicators collectively suggest a noteworthy bullish sentiment in the current market environment.
Resistance level: 104.60, 105.65
Support level: 103.85, 103.05
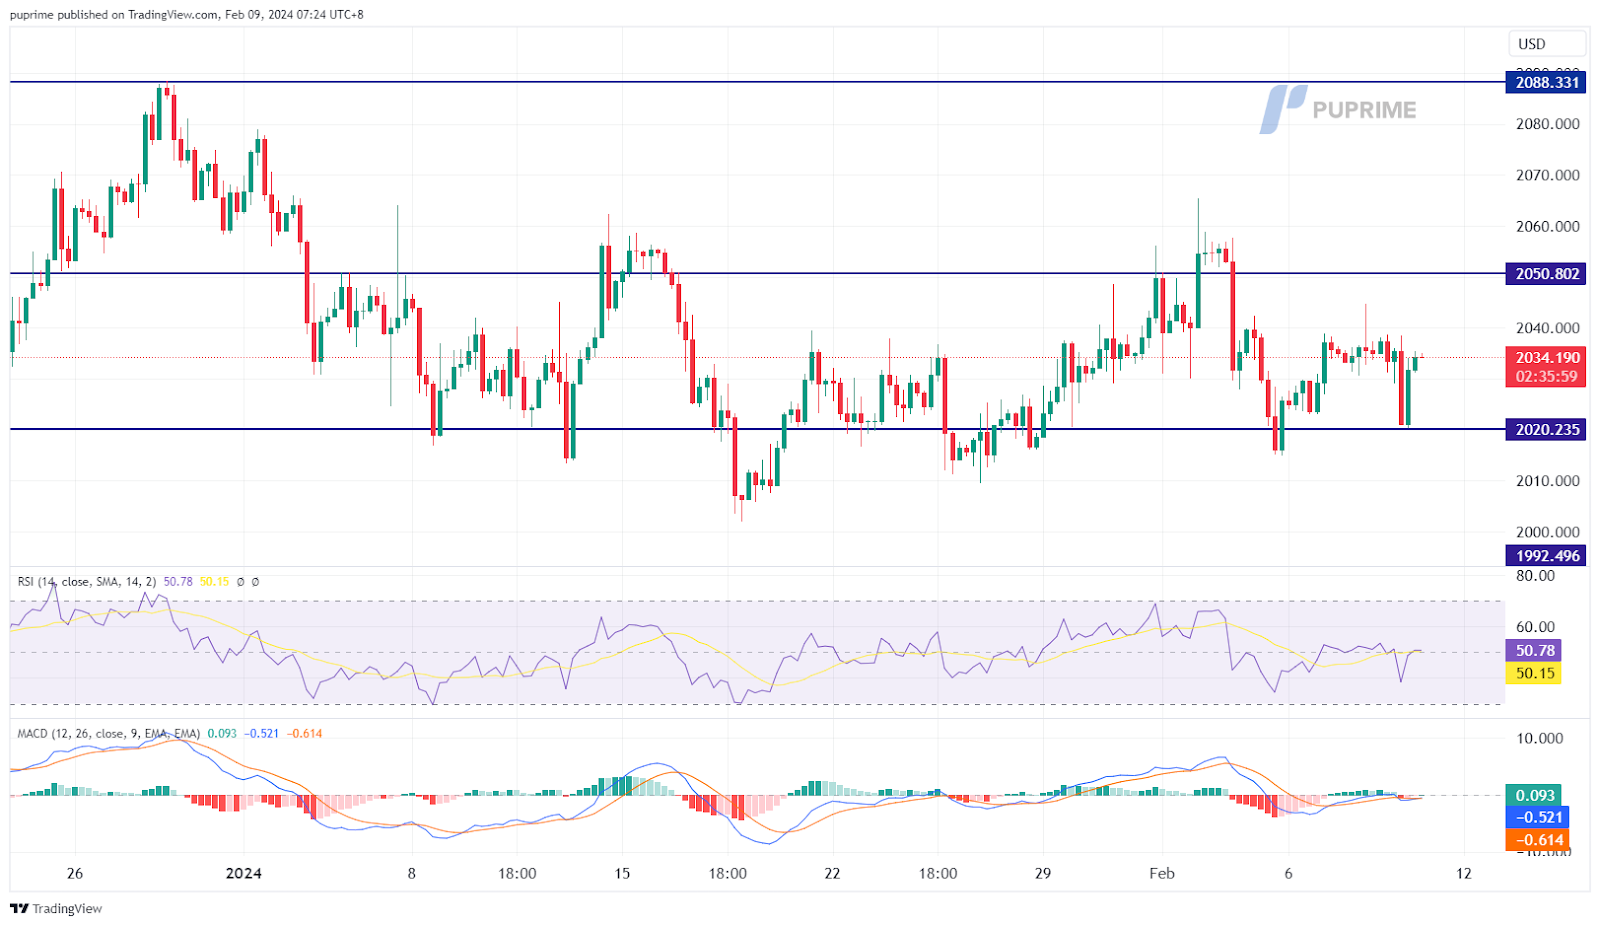
Gold prices exhibited a wide range of fluctuations last night, responding to shifts in market sentiment. Initially impacted by a strengthened dollar amid a more hawkish outlook for the Fed’s monetary policy, gold experienced volatility. However, the dynamics changed with a reversal in the ceasefire talks related to Middle East tensions, leading to renewed demand for the safe-haven commodity.
Despite the wide range of fluctuations, gold prices have not committed to a definitive directional trend, maintaining a sideways trajectory. Technical indicators reflect this indecision, with the Relative Strength Index (RSI) hovering near the 50 level, indicative of a neutral market sentiment. Simultaneously, the Moving Average Convergence Divergence (MACD) lingers in close proximity to the zero line, providing a neutral signal for gold. This confluence of factors underscores the current state of indecisiveness in the gold market.
Resistance level: 2050.00, 2088.00
Support level: 2020.00, 1992.00
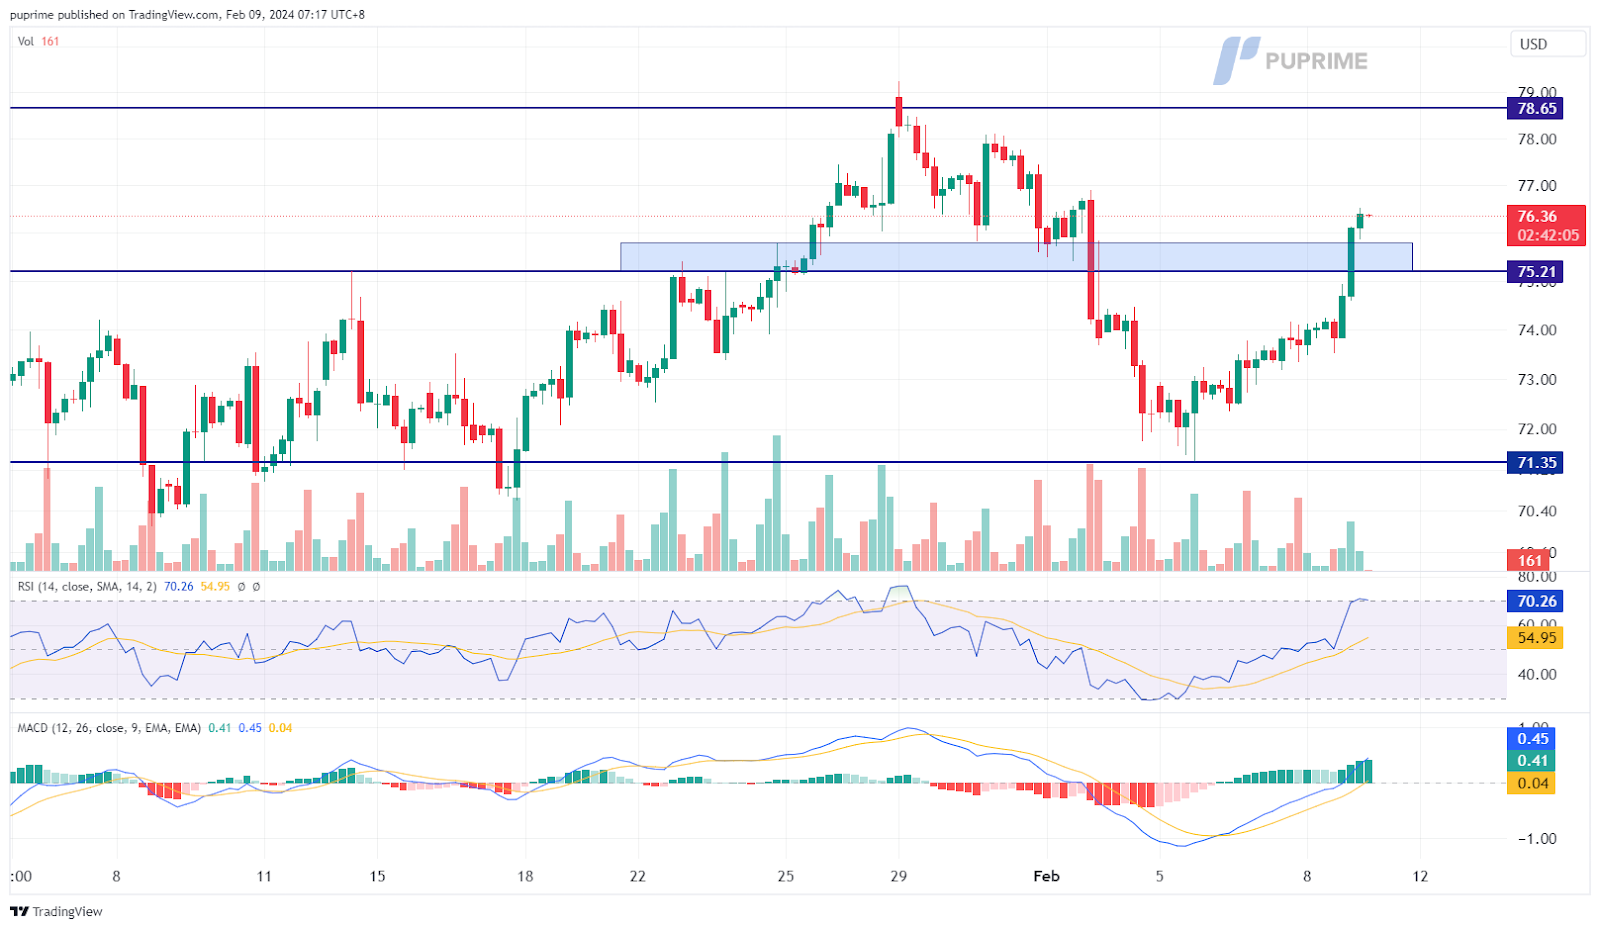
Crude oil prices exhibited strength despite a strengthened U.S. dollar, propelled by geopolitical uncertainty. Ceasefire discussions in the Middle East took a negative turn as the Israeli Prime Minister rejected the deal proposed by Hamas, deeming it delusional.
Oil prices are trading higher and have broken above their strong resistance level at near 75.2 levels, suggesting a bullish bias for oil prices. The RSI is on the brink of breaking into the overbought zone while the MACD has broken above the zero line and is diverging, suggesting the oil prices are trading with strong bullish momentum.
Resistance level: 78.60, 81.20
Support level: 75.20, 71.35

Trade with simulated capital and earn real profits after you pass our trader assessment.

20 May 2025, 06:46 Gold Slips as Ceasefire Hopes Curb Safe-Haven Demand

7 May 2025, 03:59 Geopolitical Risks and FOMC Uncertainty Shake Global Markets

6 May 2025, 05:53 Dollar Dips, Gold Rallies on U.S.-Taiwan Risk


New Registrations Unavailable
We’re not accepting new registrations at the moment.
While new sign ups are unavailable, existing users can continue their challenges and trading activities as usual.
Disclaimer: This website exclusively provides proprietary trading services. We do not engage in any regulated activities, offer investment management services, or manage funds on behalf of external clients. Our trading activities are conducted solely with the firm's own capital, and we do not accept client deposits or manage client accounts. It's important to note that none of the services we provide should be construed as investment or financial services in accordance with applicable laws.
This website offers services related to professional skill and experience assessment, which determine your eligibility to trade with the firm's capital. The outcome of these services is inherently determined by your individual skill level and ability to perform within the trading requirements and objectives outlined for each service separately. Clients are strongly advised to thoroughly understand the requirements of the services before signing up for any.
The content provided on this website is for informational purposes only and does not constitute financial, investment, or trading advice. The information presented is based on sources believed to be reliable, but we do not guarantee its accuracy, completeness, or timeliness. We disclaim any liability for any loss or damage arising directly or indirectly from the use of or reliance on the information provided on this website.
This website is not directed to residents of certain jurisdictions such as the United States, Singapore, Australia, China and some other specified regions, and is not intended for distribution to, or use by, any person in any countries or jurisdictions where such distribution or use would be contrary to local law or regulation.
This website is owned by Finzero Cap Ltd, a company incorporated in the Republic of Cyprus under registration number HE414308, with its registered office at 62 Athalassas, Mezzanine, Strovolos 2012, Nicosia, Cyprus. Finzero Cap Ltd serves as the authorized representative for PU Prime Ltd.