Join the PU Xtrader Challenge Today
Trade with simulated capital and earn real profits after you pass our trader assessment.
Join the PU Xtrader Challenge Today
Trade with simulated capital and earn real profits after you pass our trader assessment.
7 February 2024,05:28
Daily Market AnalysisMarket Insights
7 February 2024, 05:28
The Hang Seng Index shows resilience for the second consecutive session, supported by the Chinese government directing its sovereign fund to stabilize domestic equity markets. In contrast, the U.S. equity market grapples with uncertainty amid perceptions of extended Fed tightening.
The U.S. dollar pulls back from a three-month high, prompting a technical rebound in commodities like gold and oil. Traders await Chinese CPI and PPI readings, set to impact oil prices and Chinese equity indexes, shaping market sentiment in the dynamic global financial landscape.
Current rate hike bets on 20th March Fed interest rate decision:
Source: CME Fedwatch Tool
0 bps (65%) VS -25 bps (35%)
(MT4 System Time)

Source: MQL5
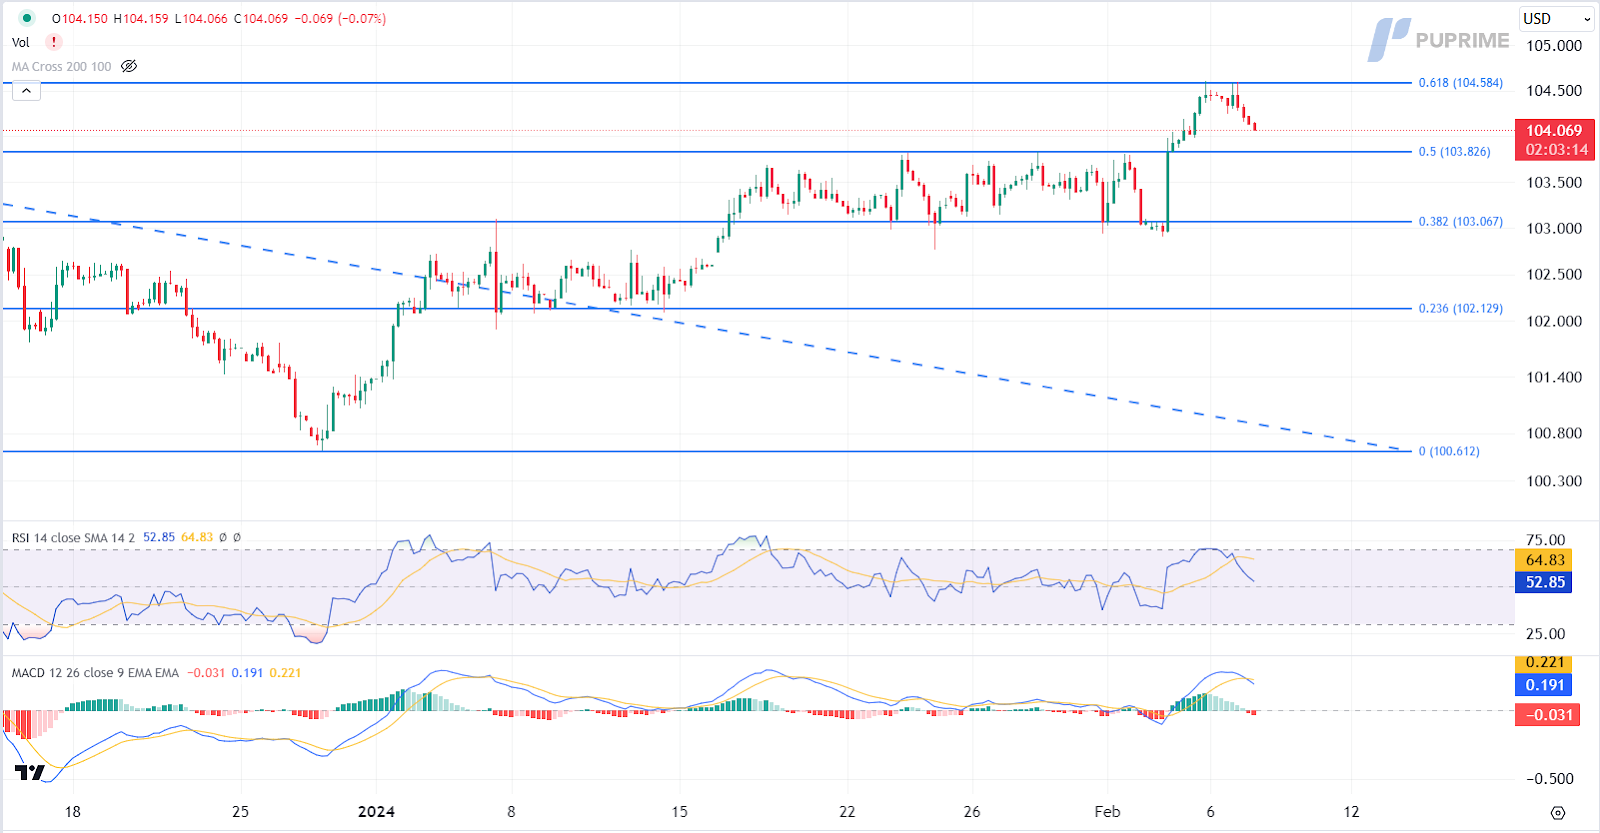
The US dollar retraced slightly after reaching its highest point in nearly three months, propelled by robust economic data and a hawkish Federal Reserve stance on interest rates. Despite the technical corrections and profit-taking activities driving this retreat, there’s a notable shift in market sentiment regarding rate cuts. Traders now project a mere 19.5% chance of a cut in March, down from the earlier expectation of 68.1% at the year’s outset, as positive US economic performance may defer rate cuts, enhancing the dollar’s long-term appeal.
The Dollar Index is currently trading lower post-retracement from the resistance level. The MACD signals increasing bearish momentum, and with the RSI at 53, there’s an indication that the index might continue its decline, particularly as the RSI retreats sharply from overbought territory
Resistance level: 104.60, 105.65
Support level: 103.85, 103.05
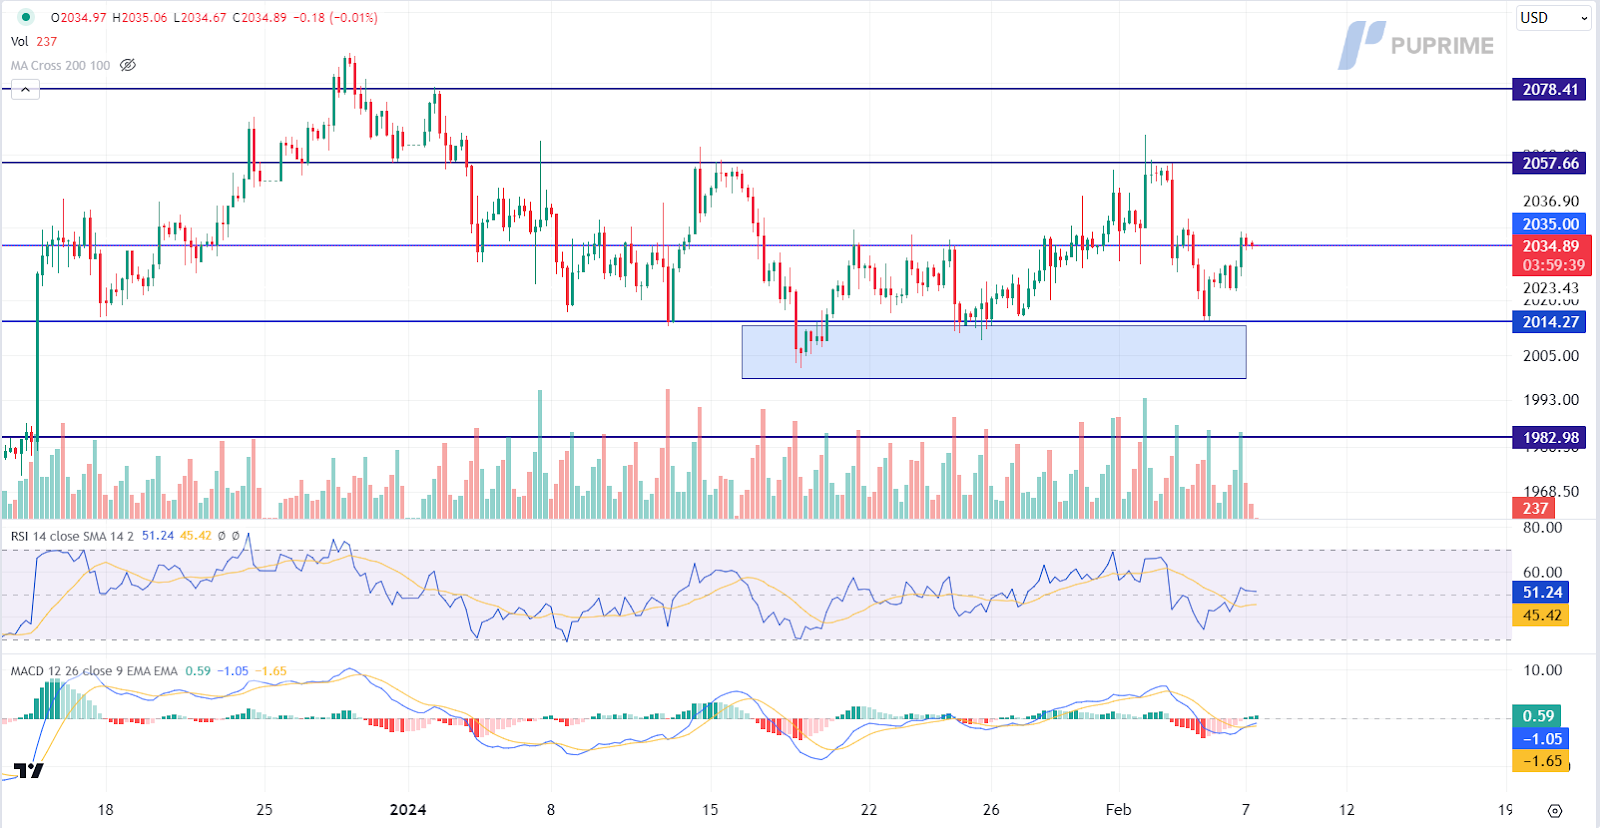
Gold prices stabilised after experiencing sharp declines in the past week, as the dollar’s rally paused for a technical correction. However, uncertainties linger regarding rising geopolitical tensions and the possibility of higher US interest rates, with markets even considering the Federal Reserve’s stance to remain static until June. Investors are advised to monitor gold’s resistance level at 2035, along with US economic data and geopolitical developments in the Middle East for trading signals.
Gold prices are trading higher while currently testing the resistance level. MACD has illustrated increasing bullish momentum, while RSI is at 51, suggesting the commodity might extend its gains after breakout since the RSI stays above the midline.
Resistance level: 2035.00, 2055.00
Support level: 2015.00, 1985.00
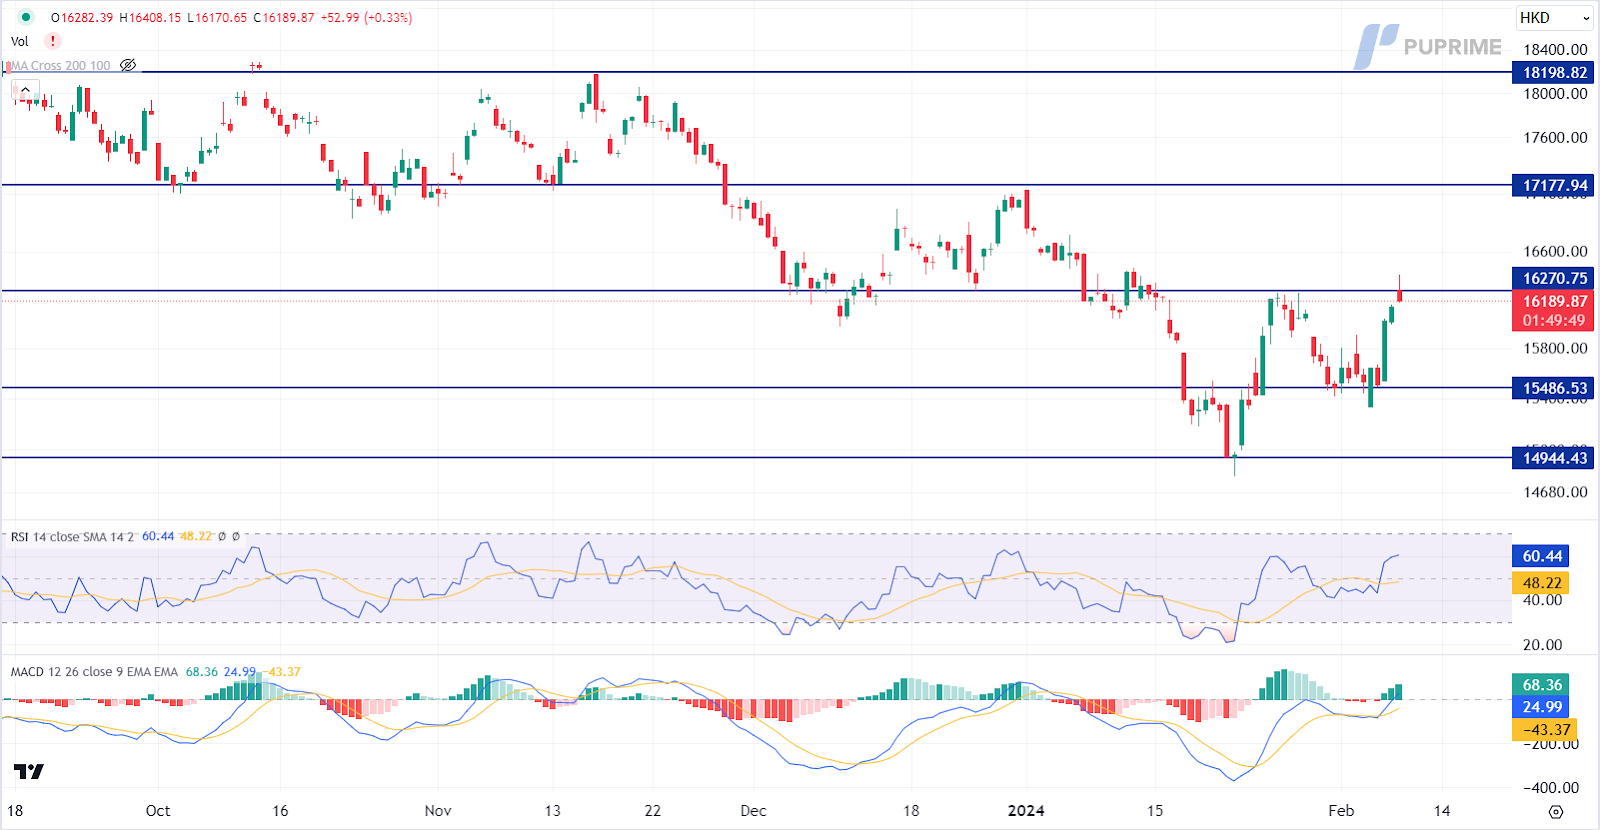
Chinese equity markets witnessed a remarkable rally, marking their most significant upturn in years. Sovereign wealth funds expressed their commitment to intensifying share purchases, responding to China’s ongoing stimulus measures aimed at bolstering the economy. This rally comes after a substantial $6.1 trillion market value erosion since the peak in February 2021. Central Huijin Investment, the equity arm of China Investment Corp, expanded its ETF holdings on mainland stock markets, supported by a statement from the China Securities Regulatory Commission endorsing such investment plans.
HK50 is trading higher while currently testing the resistance level. MACD has illustrated increasing bullish momentum, while RSI is at 61, suggesting the index might extend its gains after it successfully breakout since the RSI stays above the midline.
Resistance level: 16270.00, 17180.00
Support level: 15485.00, 14945.00

Trade with simulated capital and earn real profits after you pass our trader assessment.

20 May 2025, 06:46 Gold Slips as Ceasefire Hopes Curb Safe-Haven Demand

7 May 2025, 03:59 Geopolitical Risks and FOMC Uncertainty Shake Global Markets

6 May 2025, 05:53 Dollar Dips, Gold Rallies on U.S.-Taiwan Risk


New Registrations Unavailable
We’re not accepting new registrations at the moment.
While new sign ups are unavailable, existing users can continue their challenges and trading activities as usual.
Disclaimer: This website exclusively provides proprietary trading services. We do not engage in any regulated activities, offer investment management services, or manage funds on behalf of external clients. Our trading activities are conducted solely with the firm's own capital, and we do not accept client deposits or manage client accounts. It's important to note that none of the services we provide should be construed as investment or financial services in accordance with applicable laws.
This website offers services related to professional skill and experience assessment, which determine your eligibility to trade with the firm's capital. The outcome of these services is inherently determined by your individual skill level and ability to perform within the trading requirements and objectives outlined for each service separately. Clients are strongly advised to thoroughly understand the requirements of the services before signing up for any.
The content provided on this website is for informational purposes only and does not constitute financial, investment, or trading advice. The information presented is based on sources believed to be reliable, but we do not guarantee its accuracy, completeness, or timeliness. We disclaim any liability for any loss or damage arising directly or indirectly from the use of or reliance on the information provided on this website.
This website is not directed to residents of certain jurisdictions such as the United States, Singapore, Australia, China and some other specified regions, and is not intended for distribution to, or use by, any person in any countries or jurisdictions where such distribution or use would be contrary to local law or regulation.
This website is owned by Finzero Cap Ltd, a company incorporated in the Republic of Cyprus under registration number HE414308, with its registered office at 62 Athalassas, Mezzanine, Strovolos 2012, Nicosia, Cyprus. Finzero Cap Ltd serves as the authorized representative for PU Prime Ltd.
