Join the PU Xtrader Challenge Today
Trade with simulated capital and earn real profits after you pass our trader assessment.
Join the PU Xtrader Challenge Today
Trade with simulated capital and earn real profits after you pass our trader assessment.
4 September 2024,05:32
Daily Market Analysis
4 September 2024, 05:32
*Wall Street experienced a significant sell-off, followed by the release of the U.S. PMI, which came short of the market consensus.
*Oil prices plunged as the Libyan oil field is expected to be back in operation, and the pessimistic demand outlook is hindering the oil prices.
*The Aussie dollar lost strength as the GDP reading showed signs of lacklustre in the country’s economic performance.
Market Summary
Wall Street experienced a significant single-day sell-off yesterday, with the Nasdaq leading the decline, dropping more than 3%. Nvidia, a key player in the AI sector, saw a massive $279 billion loss in market value as its share price plunged by 9.5%. This sell-off was fueled by a softening market optimism after the U.S. PMI readings revealed tepid economic data. The S&P 500’s fear gauge, the VIX index, spiked nearly 40% during the session, indicating heightened market anxiety.
In the commodity market, gold prices were buoyed by the shift in market sentiment following the weak U.S. PMI data, gaining more than 0.5% during the New York session. In contrast, oil prices slid to their lowest levels of 2024. The resolution of Libya’s political dispute, which could ease global oil supply concerns, coupled with a disappointing Chinese Caixin PMI reading, intensified worries about oil demand and pushed prices lower.
In the forex market, the U.S. dollar remained steady, trading sideways as markets anticipate Friday’s Non-Farm Payroll (NFP) report, a crucial factor that could influence the Federal Reserve’s upcoming interest rate decision. Meanwhile, the Australian GDP data, released during the Sydney session, met market expectations but indicated signs of economic retreat, weakening the Aussie dollar.
Current rate hike bets on 18th September Fed interest rate decision:
Source: CME Fedwatch Tool
-50 bps (32.5%) VS -25 bps (67.5%)
Market Movements

DOLLAR_INDX, H4
The Dollar Index rebounded slightly due to technical correction ahead of the release of several crucial US economic reports. Investor focus this week will be on US payrolls data, particularly after Fed Chair Jerome Powell hinted at potential interest rate cuts due to concerns over a softening labor market. Economists expect a rise in US jobs in August, and upcoming job openings data and jobless claims reports will also be closely monitored.
The Dollar Index is trading higher while currently testing the resistance level. MACD has illustrated increasing bullish momentum, while RSI is at 40, suggesting the index might extend its gains after breakout since the RSI rebounded sharply from oversold territory.
Resistance level: 101.70, 102.35
Support level: 100.55, 99.70

Gold prices tumbled, primarily due to a technical breakout after falling below a crucial support level. The unexpectedly strong performance in the US economy has added to the uncertainty, leading some investors to sell off gold and take profits while adopting a wait-and-see approach. Key economic indicators this week, including Nonfarm Payrolls and the US Unemployment Rate, will be critical in shaping the future movement of gold prices.
Gold prices are trading lower while currently near the support level. However, MACD has illustrated diminishing bearish momentum, while RSI is at 42, suggesting the commodity might experience technical correction since the RSI rebounded sharply from oversold territory.
Resistance level: 2505.00, 2525.00
Support level: 2480.00, 2450.00

The GBP/USD pair remains below the key fair value gap, indicating that it is still trading within a bearish trend. However, the bearish momentum appears to be easing, suggesting that the pair may be approaching a critical juncture. Traders will be closely watching upcoming economic indicators, including the UK PMI readings set for release during the London session, followed by the U.S. job data later in the day. These reports could play a pivotal role in determining whether the pair will continue its downward trajectory or potentially reverse course.
GBP/USD remains below the fair value gap; however, the bearish momentum seems to be easing. The RSI remains below the 50 level, while the MACD has crossed below the zero line, suggesting the pair remains trading with bearish momentum.
Resistance level: 1.3140, 1.3220
Support level: 1.3065, 1.2980

The Euro is currently supported near the 1.1040 level, forming a double-bottom price pattern that suggests a potential trend reversal for the EUR/USD pair. The U.S. PMI reading released yesterday fell short of expectations, which has weakened the dollar’s momentum and provided some buoyancy for the Euro. Traders will now turn their attention to the U.S. job data due later today, which could be a pivotal factor in determining the pair’s next move. If the job data disappoints, it could further weaken the dollar and bolster the Euro, potentially confirming the trend reversal signalled by the double-bottom pattern.
EUR/USD has eased from its bearish momentum and is supported at the near 1.1040 level. The RSI remains close to the oversold zone, while the MACD has a golden cross below the zero line, suggesting the bearish momentum is easing.
Resistance level: 1.1106, 1.1170
Support level: 1.0985, 1.0940
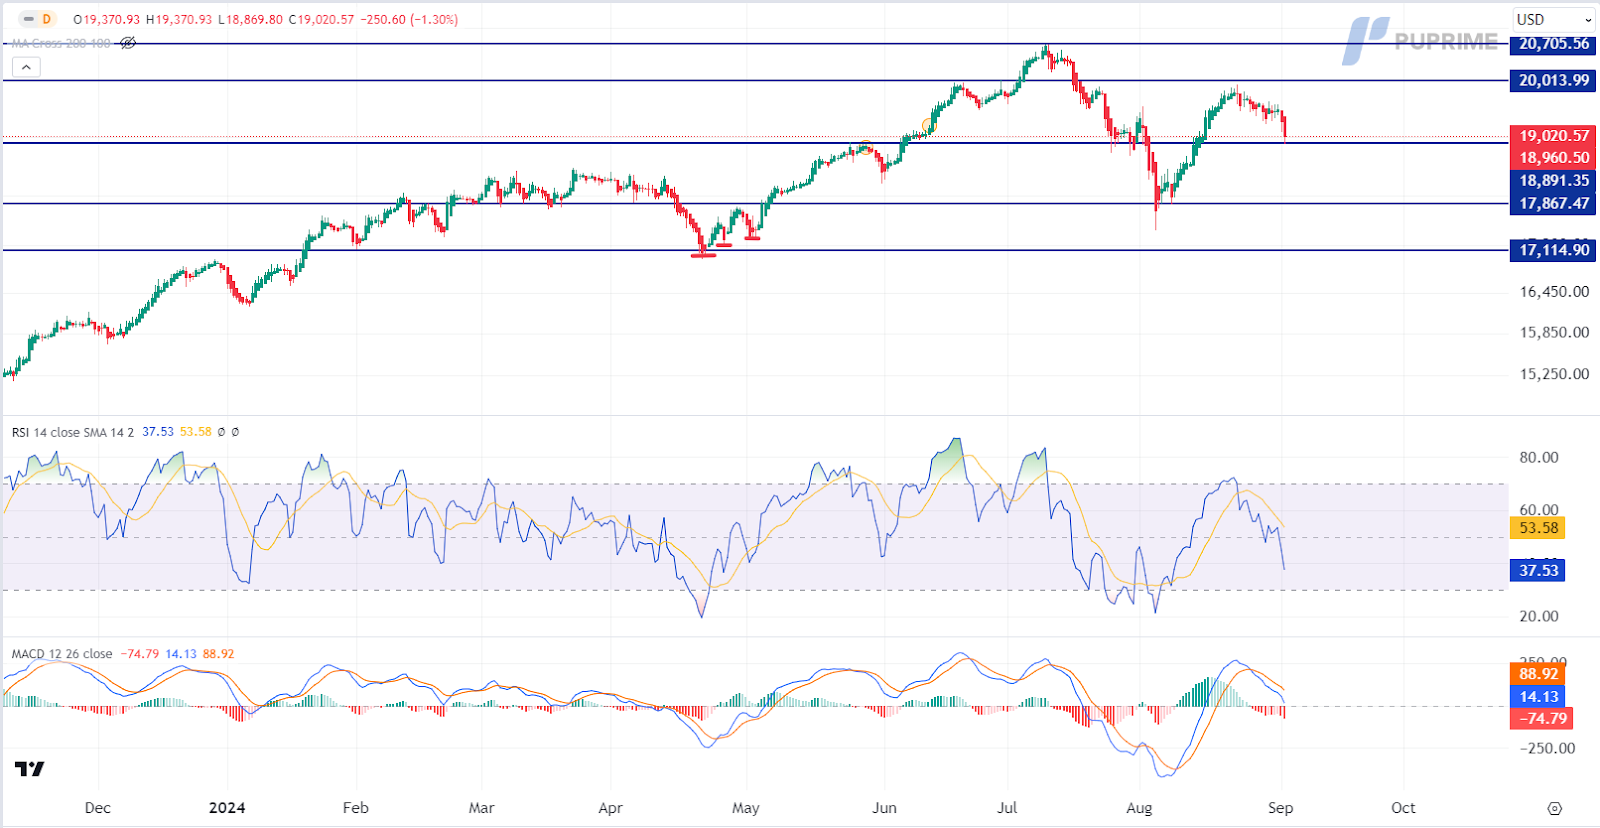
Global risk appetite remained weak as major US equity indexes posted their worst day since the August 5th rout. Weak US economic data and falling oil prices heightened concerns about the global economy’s health. The risk-off sentiment was further fueled by a strengthening yen and disappointing US manufacturing data, which raised fears of a resurgence in carry trade risks similar to past events when the Nikkei experienced significant declines..
Nasdaq is trading lower while currently testing the support level. MACD has illustrated increasing bearish momentum, while RSI is at 38, suggesting the index might extend its losses after breakout since the RSI stays below the midline.
Resistance level: 20015.00, 20705.00
Support level:18890.00, 17865.00
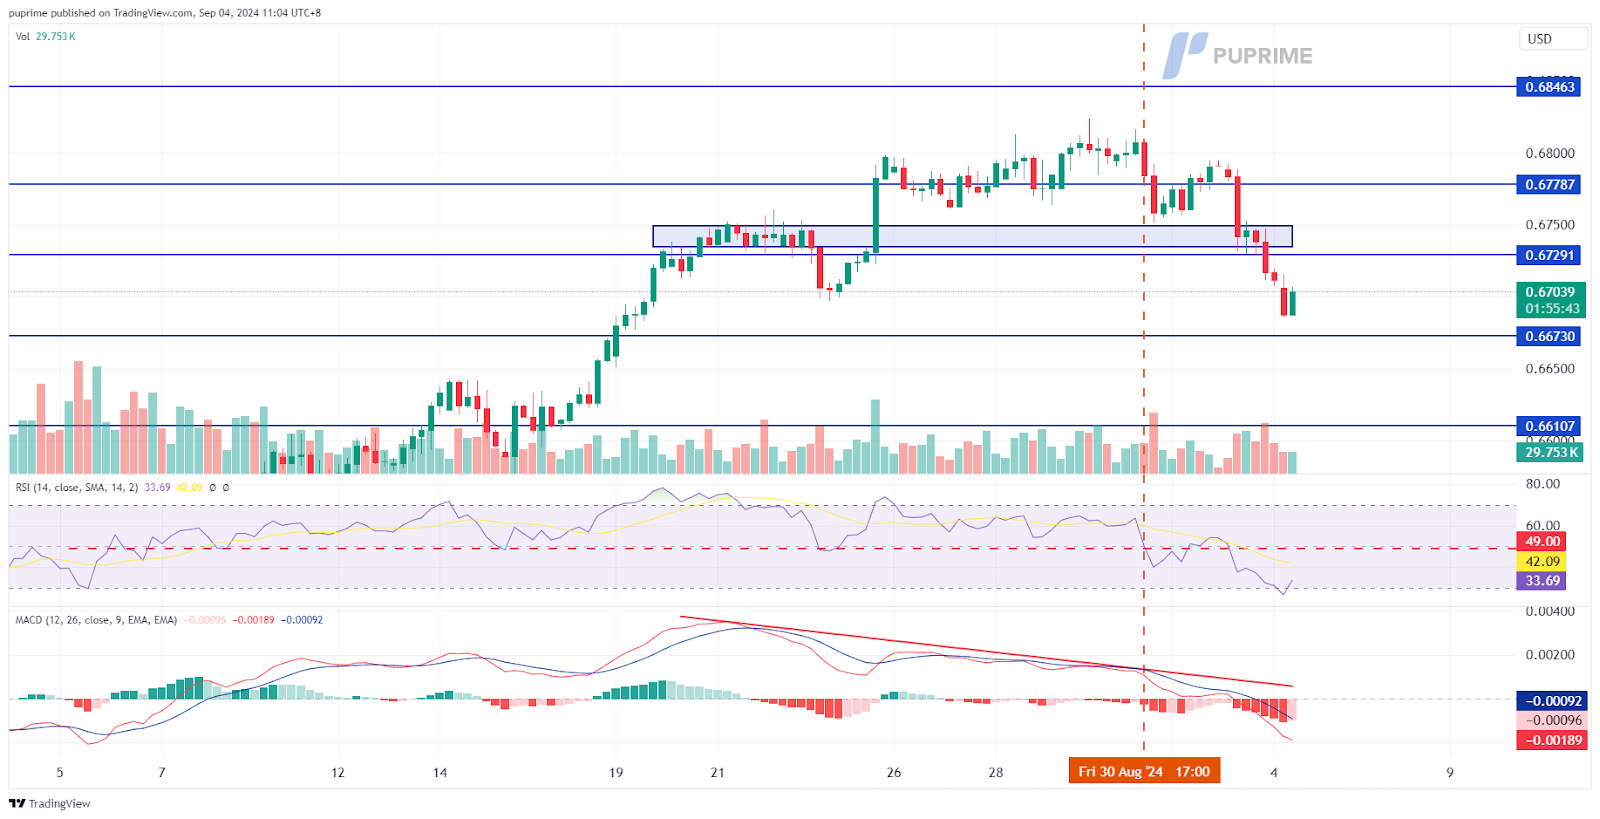
The AUD/USD pair has broken below its liquidity zone, signalling a strong bearish trend. This movement aligns with the earlier MACD bearish divergence, which had indicated a potential trend reversal for the pair. The Australian GDP reading met market expectations at 1%, suggesting that the country’s economic performance is slowing, further weakening the Aussie dollar. This confluence of technical and fundamental factors points to continued downside pressure on the AUD/USD pair.
The pair is currently trading with strong bearish momentum and has dropped by more than 1% in the last session. The RSI is close to breaking into the oversold zone, while the MACD has broken below the zero line, suggesting that bearish momentum is gaining.
Resistance level: 0.6730, 0.6780
Support level: 0.6670, 0.6610
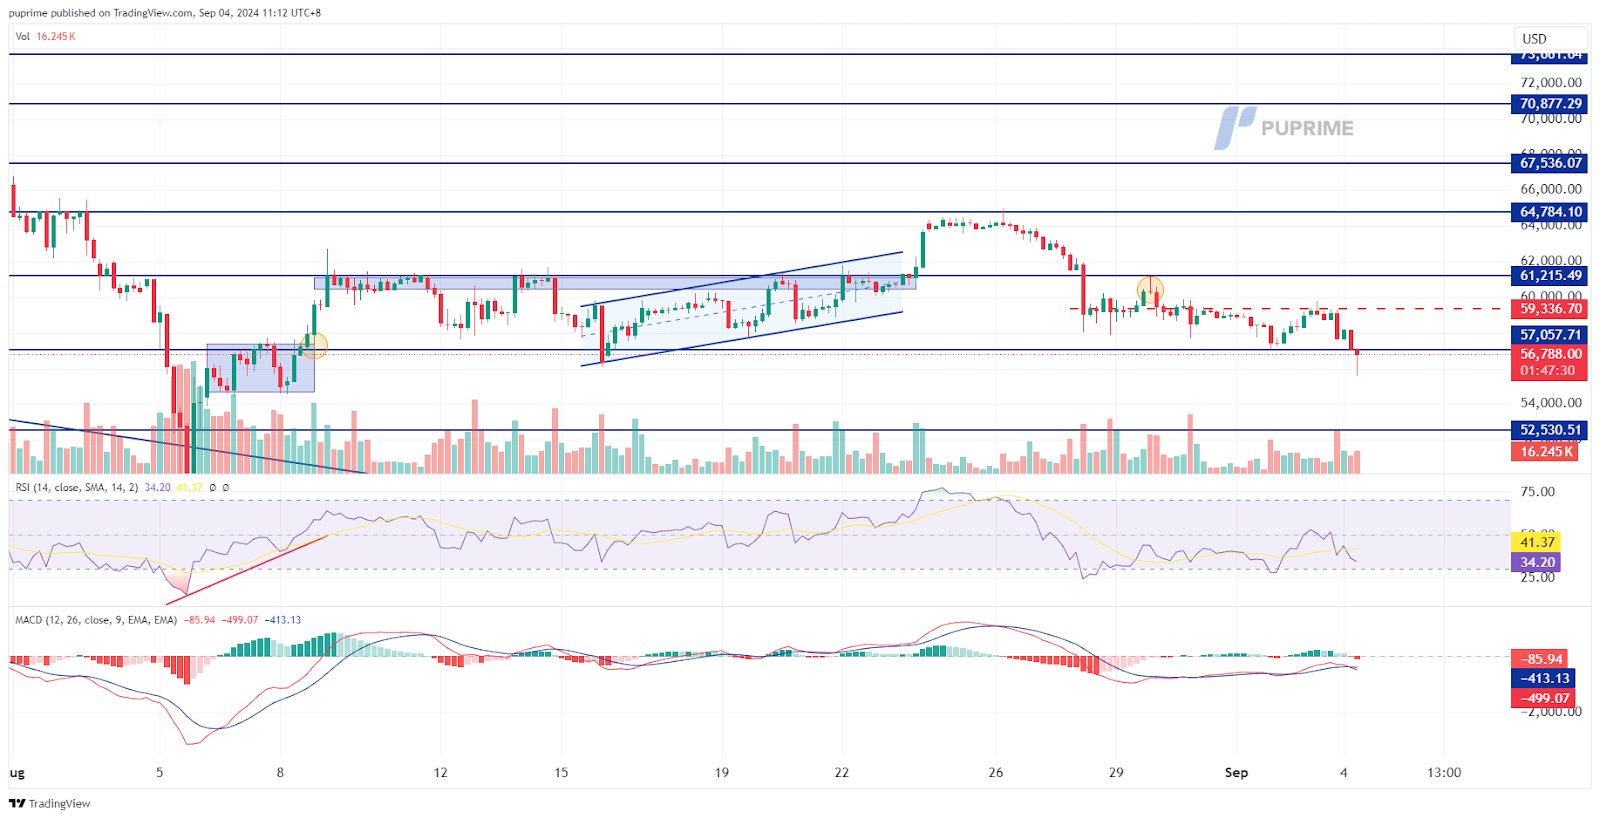
BTC dropped below the $56,000 mark, impacted by the broader negative sentiment in financial markets after a significant sell-off on Wall Street. The potential for a Bank of Japan (BoJ) rate hike, which could strain global liquidity due to the unwinding of Yen carry trades, has also weighed on BTC’s price movement. Despite this pressure, BTC has seen large purchases in recent sessions, indicating strong demand around the $60,000 level, which may act as a key support zone for the cryptocurrency.
BTC continued to trade in its bearish trajectory, but BTC prices quickly rebounded after hitting below the $56000 mark, suggesting strong support at such a level. The RSI shows signs of rebounding from the oversold zone, while the MACD is close to breaking above the zero line, suggesting the bearish momentum is easing.
Resistance level: 61250.00, 64800.00
Support level: 52530.00, 48000.00
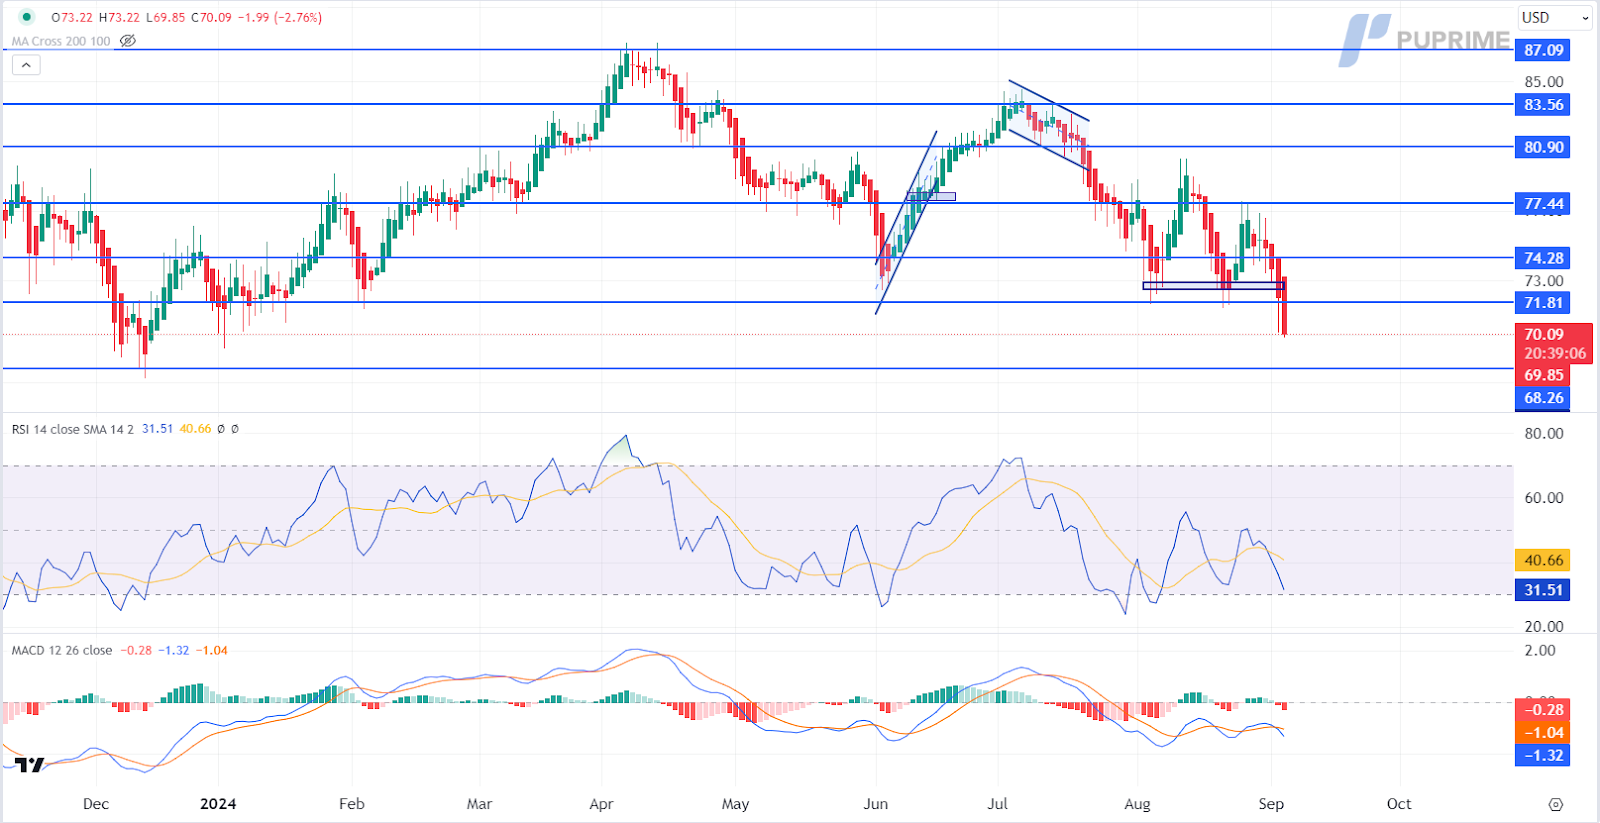
Oil prices experienced a significant selloff following news that Libyan oil supply might return to the market, easing fears of supply disruptions. The selloff was triggered by reports of potential resolution in Libya’s political crisis, which had caused a halt in crude production and exports. The announcement of an agreement to name a new central bank governor within 30 days raised hopes of an end to the deadlock that has disrupted Libya’s oil exports.
Oil prices are trading lower following the prior breakout below the previous support level. MACD has illustrated increasing bearish momentum, while RSI is at 32, suggesting the commodity might extend its losses since the RSI stays below the midline.
Resistance level: 71.80, 74.30
Support level: 68.25, 65.80

Trade with simulated capital and earn real profits after you pass our trader assessment.

20 May 2025, 06:46 Gold Slips as Ceasefire Hopes Curb Safe-Haven Demand

7 May 2025, 03:59 Geopolitical Risks and FOMC Uncertainty Shake Global Markets

6 May 2025, 05:53 Dollar Dips, Gold Rallies on U.S.-Taiwan Risk


New Registrations Unavailable
We’re not accepting new registrations at the moment.
While new sign ups are unavailable, existing users can continue their challenges and trading activities as usual.
Disclaimer: This website exclusively provides proprietary trading services. We do not engage in any regulated activities, offer investment management services, or manage funds on behalf of external clients. Our trading activities are conducted solely with the firm's own capital, and we do not accept client deposits or manage client accounts. It's important to note that none of the services we provide should be construed as investment or financial services in accordance with applicable laws.
This website offers services related to professional skill and experience assessment, which determine your eligibility to trade with the firm's capital. The outcome of these services is inherently determined by your individual skill level and ability to perform within the trading requirements and objectives outlined for each service separately. Clients are strongly advised to thoroughly understand the requirements of the services before signing up for any.
The content provided on this website is for informational purposes only and does not constitute financial, investment, or trading advice. The information presented is based on sources believed to be reliable, but we do not guarantee its accuracy, completeness, or timeliness. We disclaim any liability for any loss or damage arising directly or indirectly from the use of or reliance on the information provided on this website.
This website is not directed to residents of certain jurisdictions such as the United States, Singapore, Australia, China and some other specified regions, and is not intended for distribution to, or use by, any person in any countries or jurisdictions where such distribution or use would be contrary to local law or regulation.
This website is owned by Finzero Cap Ltd, a company incorporated in the Republic of Cyprus under registration number HE414308, with its registered office at 62 Athalassas, Mezzanine, Strovolos 2012, Nicosia, Cyprus. Finzero Cap Ltd serves as the authorized representative for PU Prime Ltd.
