Join the PU Xtrader Challenge Today
Trade with simulated capital and earn real profits after you pass our trader assessment.
Join the PU Xtrader Challenge Today
Trade with simulated capital and earn real profits after you pass our trader assessment.
19 September 2023,05:35
Daily Market Analysis
19 September 2023, 05:35
The Dollar Index has remained relatively stable but at a robust level above the $105 threshold. This steadiness aligns with the prevailing sentiment in the equity markets as investors await the forthcoming Federal Reserve interest rate decision scheduled for Wednesday(September 20th). In contrast, gold prices have been on an upward trajectory since last Friday. This trend stems from widespread market expectations that the Fed will maintain its current interest rates in September. Meanwhile, oil prices have maintained their bullish momentum. Analysts are predicting that oil prices may reach $100 before the year concludes. This optimism is grounded in concerns over a supply deficit, especially considering that U.S. shale oil output has been on a decline and is forecasted to persist for the third consecutive month in October.
Current rate hike bets on 20th September Fed interest rate decision:
Source: CME Fedwatch Tool
0 bps (93.0%) VS 25 bps (7.0%)
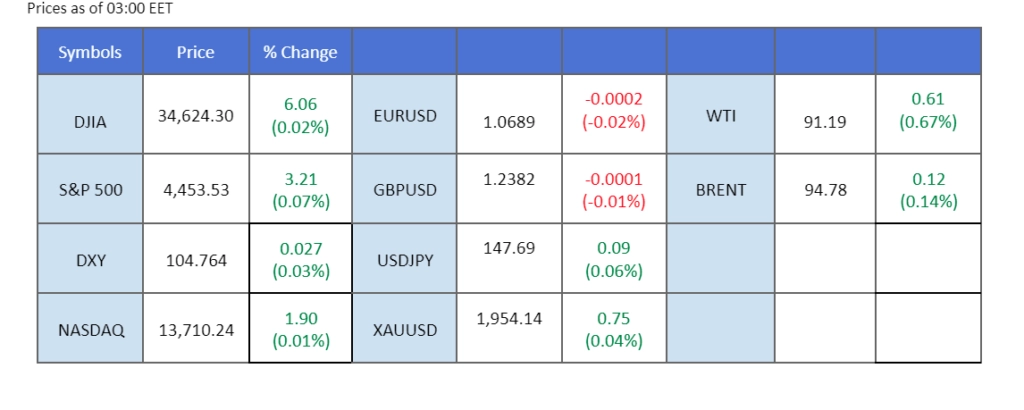
The US dollar continues to face pressure, albeit from a position near a six-month high, as investors seize the opportunity to take profits ahead of a week brimming with pivotal events. Eyes are firmly fixed on interest rate decisions this week by the Federal Reserve, the Bank of England, and the Bank of Japan. Despite the greenback’s losses, it finds solace in the reassuring statements of US Treasury Secretary Janet Yellen, who unequivocally states that there are no ominous signs of the US economy veering into a downturn.
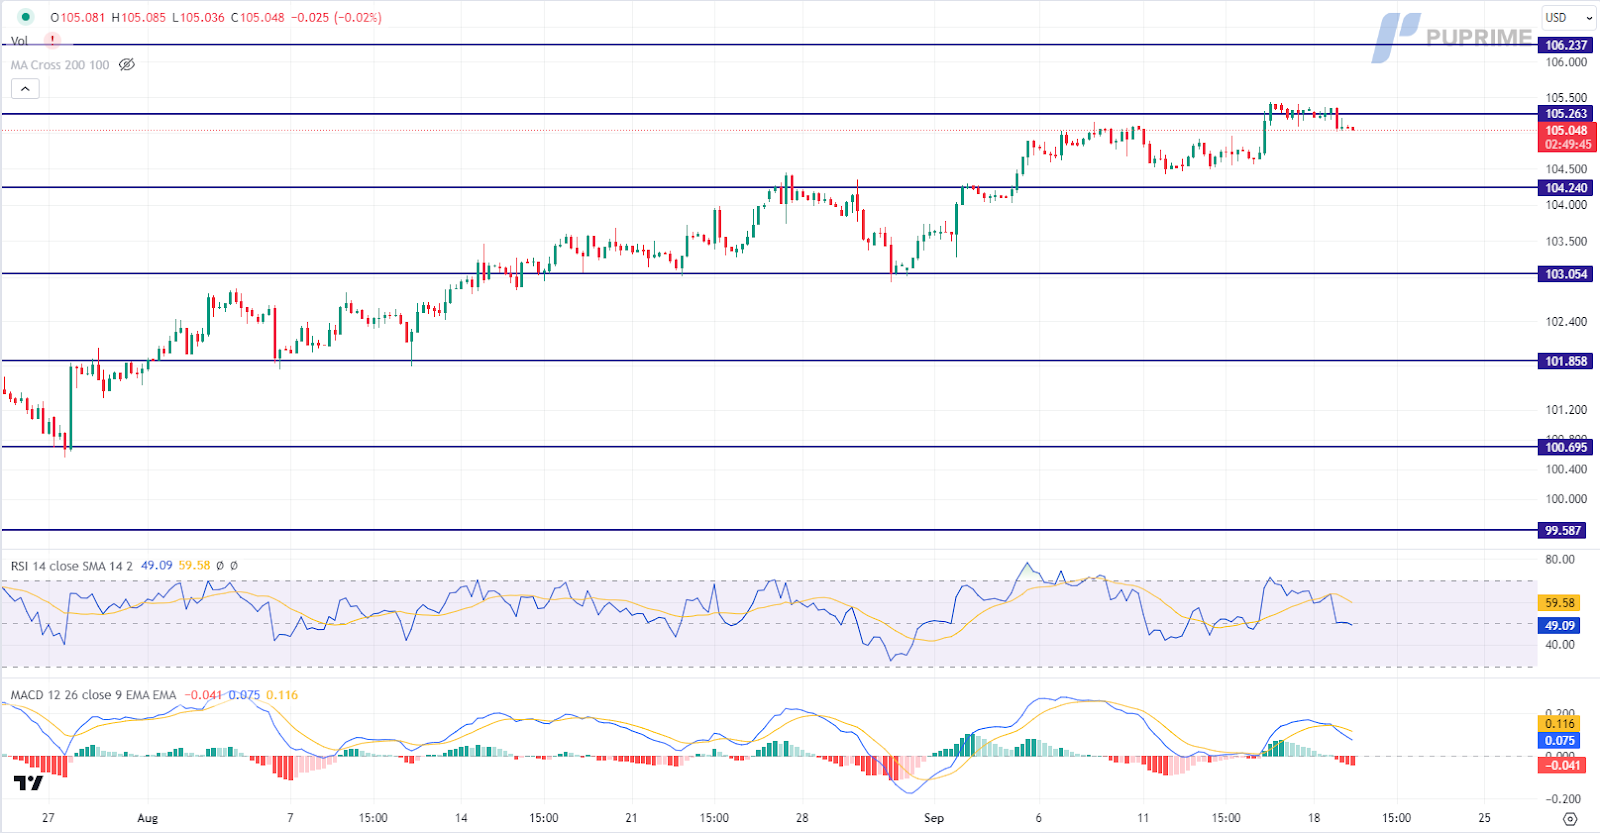
The Dollar Index is trading lower following the prior retracement from the resistance level. MACD has illustrated increasing bearish momentum, while RSI is at 49, suggesting the index might extend its losses since the RSI retreated sharply from overbought territory.
Resistance level: 105.25, 106.25
Support level: 104.25, 103.05
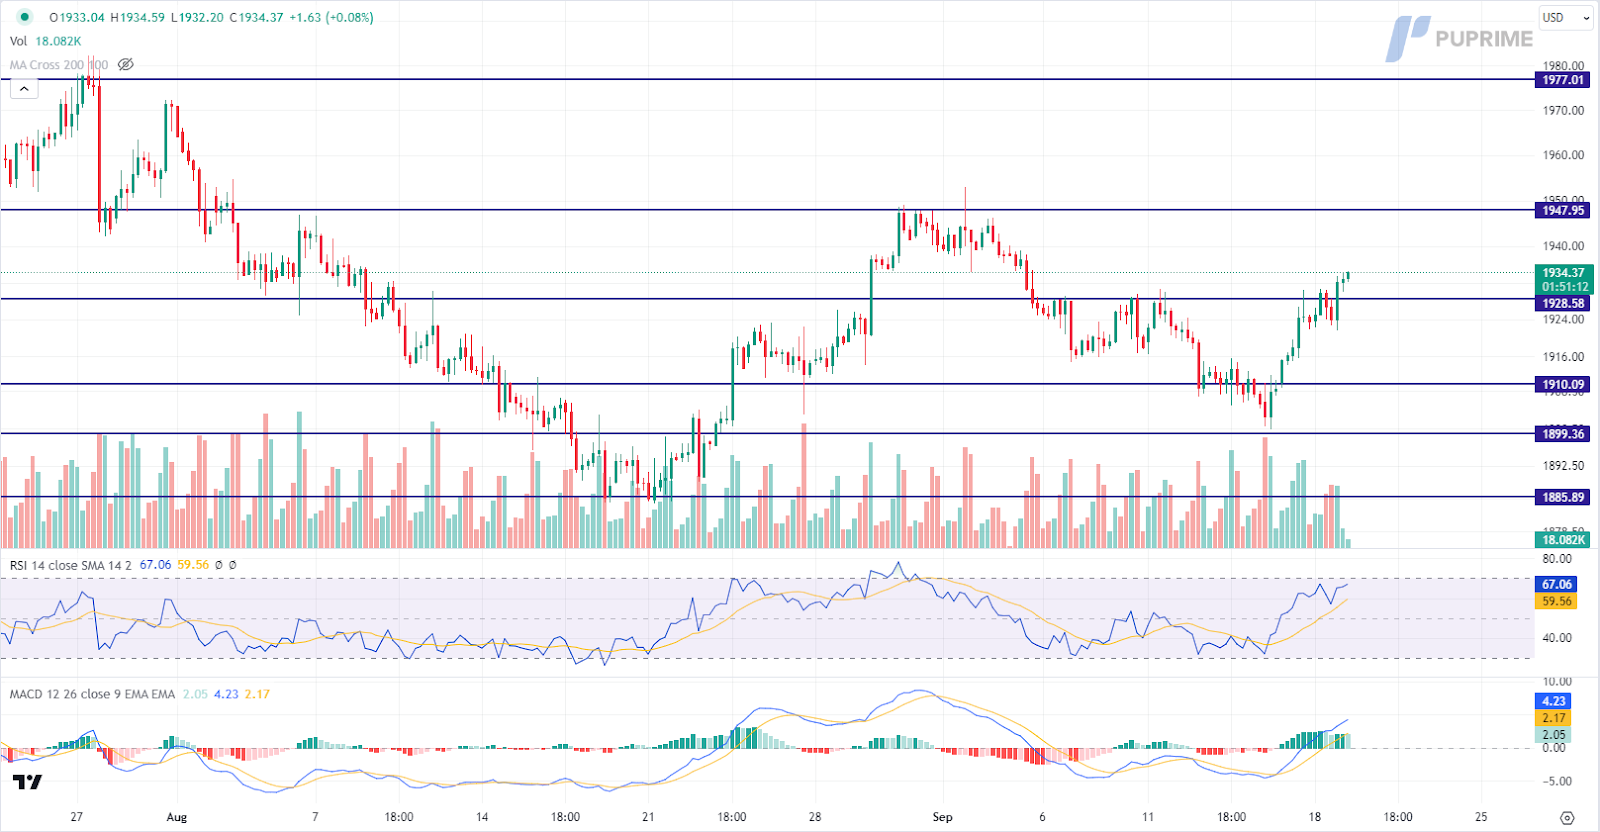
Escalating political risks in the United States, coupled with the looming threat of a government shutdown, have buoyed the demand for gold. Although analysts suggest the economic impact of a potential shutdown may be minimal, market participants remain watchful of developments.
Gold prices are trading higher following the prior breakout above the resistance level. However, MACD has illustrated diminishing bullish momentum, while RSI is at 67, suggesting the commodity might enter overbought territory.
Resistance level: 1950.00, 1975.00
Support level: 1930.00, 1910.00

The euro found support near 1.0650 against the dollar, experiencing a slight rebound as the dollar’s bullish momentum temporarily waned. This shift is driven by expectations that the Federal Reserve will keep interest rates steady in September, preventing the dollar index from maintaining its surge above $105. Additionally, the release of Eurozone Consumer Price Index (CPI) data today is under scrutiny, providing insights into the euro’s strength amid ongoing economic concerns in the Eurozone.
EUR/USD has consolidated and has a rebound, but the lower high price pattern suggests that the pair is still trading in a bearish momentum. The RSI has rebounded but remains below the 50-level while the MACD still flows below the zero line, suggesting the bearish momentum is still intact.
Resistance level:1.0700, 1.0760
Support level: 1.0640, 1.0540
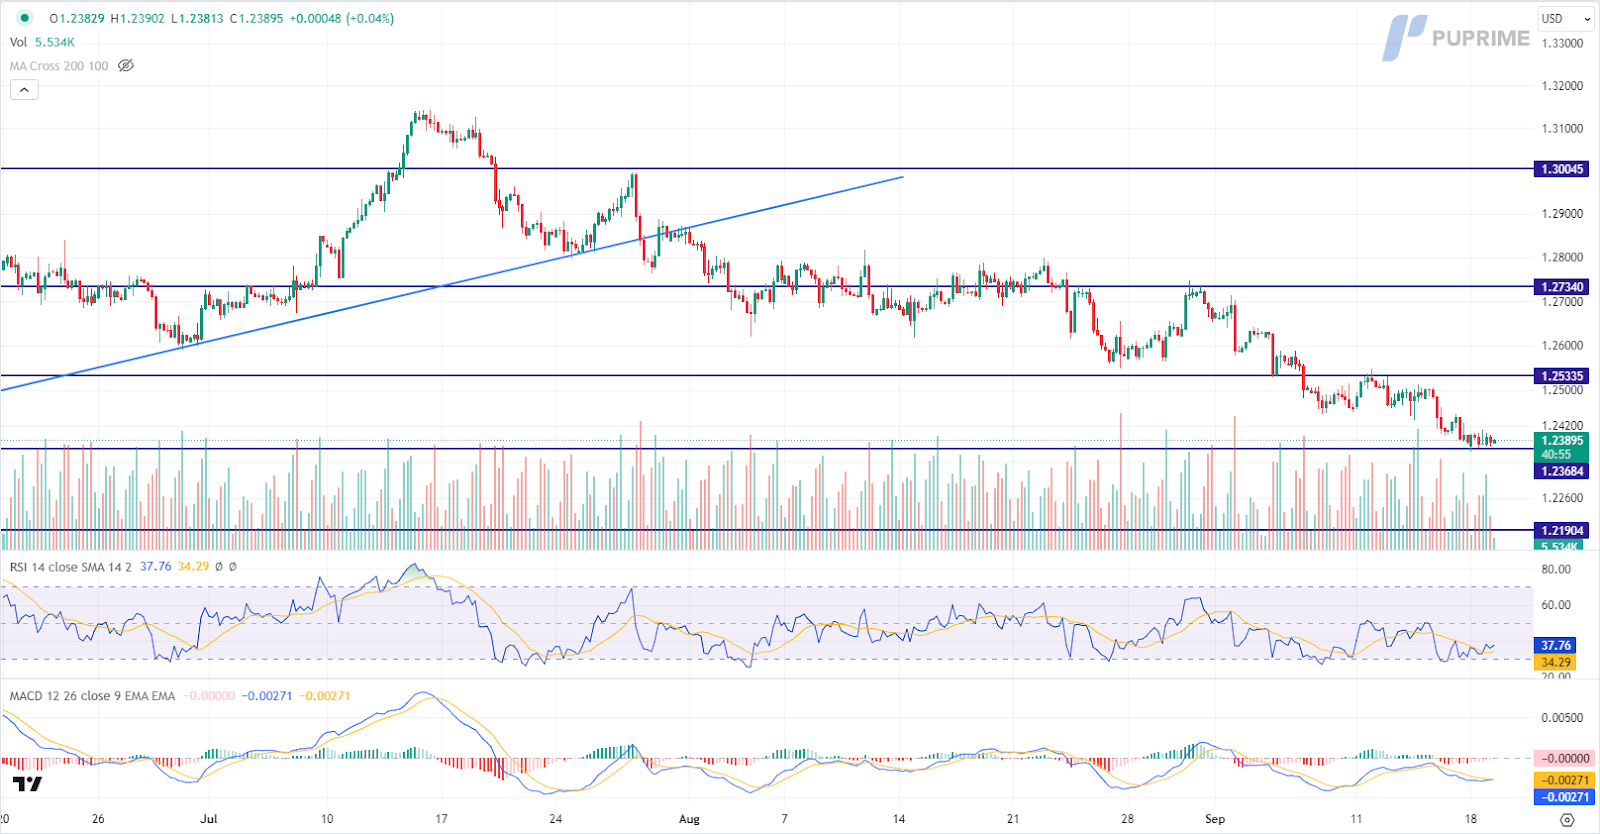
Pound Sterling maintains a downward trajectory as market anticipation builds before the Bank of England’s interest rate announcement. Economists are unanimous in their expectation that this is likely the final rate hike for the BoE in the current cycle. All eyes are on the decision, with forecasts pointing toward a 25-basis point increase, propelling borrowing costs to 5.5%, a level last seen in early 2008.
Pound Sterling is trading lower while currently testing the support level. However, MACD has illustrated diminishing bearish momentum, while RSI is at 38, suggesting the pair might experience technical correction since the RSI rebounded sharply from oversold territory.
Resistance level: 1.2535, 1.2735
Support level: 1.2370, 1.2190

The New Zealand dollar has shown resilience against the robust US dollar but now faces resistance at the 0.5935 level. This resilience is attributed to expectations of a Federal Reserve interest rate pause and ongoing economic stimulus policy from the Chinese government. Additionally, market participants are anticipating New Zealand’s GDP data release on Thursday (September 21st) to gain insights into potential price movements for the currency pair.
The Kiwi has a higher low against the robust dollar, suggesting that the pair might have a trend reversal from its long-term bearish trend since July. The RSI remains flat near the 50-level while the MACD flows along with the zero line, suggesting that the momentum with the pair is low.
Resistance level: 0.5980, 0.6050
Support level: 0.5910, 0.5860

In the midst of a week marked by heightened volatility, US equity markets exhibit resilience, bolstered by the ascent of Apple Inc. shares. Apple’s impressive 1% surge is attributed to robust demand for its newly launched iPhone 15, particularly the higher-priced iPhone Pro and Pro Max models, as compared to initial demand for the iPhone 14. Nevertheless, investors are poised to scrutinise the forthcoming monetary pronouncements from major central banks, including the Federal Reserve, for further directional cues.
The Dow is trading higher following the prior rebound from the upward trend line. However, MACD has illustrated diminishing bullish momentum, while RSI is at 48, suggesting the index might experience technical correction since the RSI stays below the midline.
Resistance level: 34900.00, 35590.00
Support level: 34355.00, 33720.00
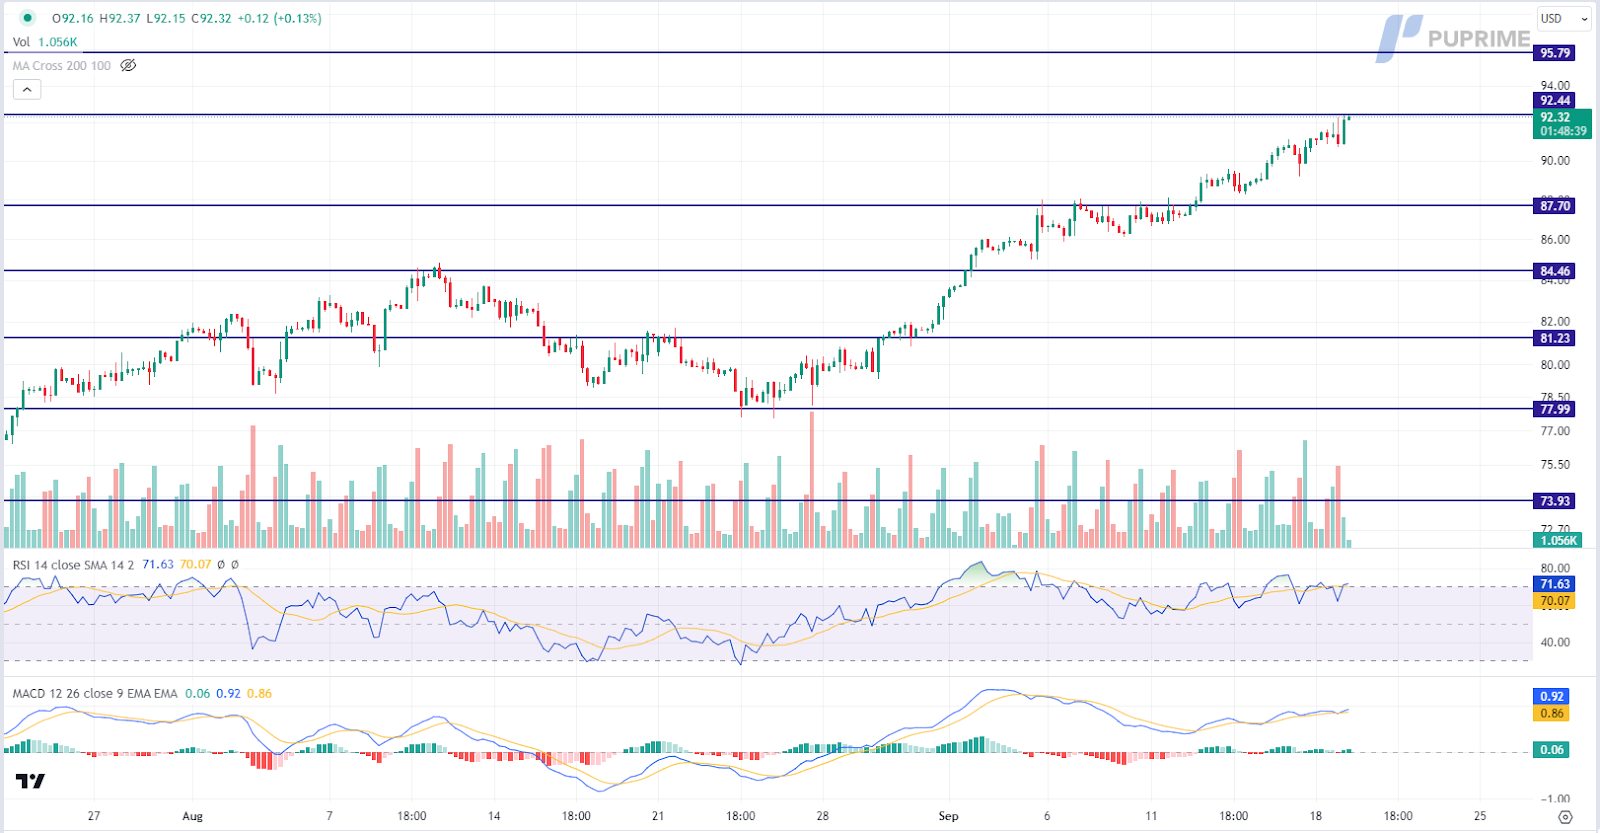
Oil prices continue their upward trajectory, with investors digesting the substantial production cuts implemented by the OPEC+ alliance, which have tilted the market into a significant deficit in the fourth quarter. Oil traders, however, remain attuned to central bank policy-setting meetings, recognizing the potential indirect impacts on oil prices stemming from monetary decisions.
Oil prices are trading higher while currently near the resistance level. However, MACD has illustrated diminishing bullish momentum, while RSI is at 72, suggesting the commodity might enter overbought territory.
Resistance level: 92.45, 95.80
Support level: 87.70, 84.45

Trade with simulated capital and earn real profits after you pass our trader assessment.

20 May 2025, 06:46 Gold Slips as Ceasefire Hopes Curb Safe-Haven Demand

7 May 2025, 03:59 Geopolitical Risks and FOMC Uncertainty Shake Global Markets

6 May 2025, 05:53 Dollar Dips, Gold Rallies on U.S.-Taiwan Risk


New Registrations Unavailable
We’re not accepting new registrations at the moment.
While new sign ups are unavailable, existing users can continue their challenges and trading activities as usual.
Disclaimer: This website exclusively provides proprietary trading services. We do not engage in any regulated activities, offer investment management services, or manage funds on behalf of external clients. Our trading activities are conducted solely with the firm's own capital, and we do not accept client deposits or manage client accounts. It's important to note that none of the services we provide should be construed as investment or financial services in accordance with applicable laws.
This website offers services related to professional skill and experience assessment, which determine your eligibility to trade with the firm's capital. The outcome of these services is inherently determined by your individual skill level and ability to perform within the trading requirements and objectives outlined for each service separately. Clients are strongly advised to thoroughly understand the requirements of the services before signing up for any.
The content provided on this website is for informational purposes only and does not constitute financial, investment, or trading advice. The information presented is based on sources believed to be reliable, but we do not guarantee its accuracy, completeness, or timeliness. We disclaim any liability for any loss or damage arising directly or indirectly from the use of or reliance on the information provided on this website.
This website is not directed to residents of certain jurisdictions such as the United States, Singapore, Australia, China and some other specified regions, and is not intended for distribution to, or use by, any person in any countries or jurisdictions where such distribution or use would be contrary to local law or regulation.
This website is owned by Finzero Cap Ltd, a company incorporated in the Republic of Cyprus under registration number HE414308, with its registered office at 62 Athalassas, Mezzanine, Strovolos 2012, Nicosia, Cyprus. Finzero Cap Ltd serves as the authorized representative for PU Prime Ltd.
