Join the PU Xtrader Challenge Today
Trade with simulated capital and earn real profits after you pass our trader assessment.
Join the PU Xtrader Challenge Today
Trade with simulated capital and earn real profits after you pass our trader assessment.
1 July 2024,06:11
Daily Market Analysis
1 July 2024, 06:11
*The dollar’s strength was tempered by the PCE reading that suggests the inflation in the U.S. is mitigating.
*The euro jumped significantly after the political uncertainty in France was resolved.
*BTC rebounded strongly from its bearish trend.
The dollar’s recent strength was tempered by last Friday’s Personal Consumption Expenditures (PCE) reading, which aligned with market expectations. The mixed results of recent U.S. economic indicators have cast uncertainty over the Federal Reserve’s upcoming monetary policy moves, although part of the market remains optimistic about an October rate cut.
The euro surged against its peers at the start of the week, buoyed by the resolution of political uncertainty following the first round of legislative elections over the weekend. However, the euro’s strength was capped by dovish signals from the European Central Bank (ECB), which indicated plans for two more rate cuts this year.
In the commodities market, gold traded flat due to a lack of catalysts and updates on geopolitical tensions in the Middle East. In contrast, oil prices edged slightly higher as the Chinese Caixin Manufacturing PMI readings indicated an economic recovery in China, boosting the demand outlook for oil.
In addition, Bitcoin (BTC) prices surged by more than 3% in the last session, driven by a shift in market sentiment. However, reports suggest that the U.S. Securities and Exchange Commission (SEC) is set to delay the launch of the Ethereum (ETH) ETF until later this month.
Current rate hike bets on 31st July Fed interest rate decision:
Source: CME Fedwatch Tool
0 bps (89.7%) VS -25 bps (10.3%)
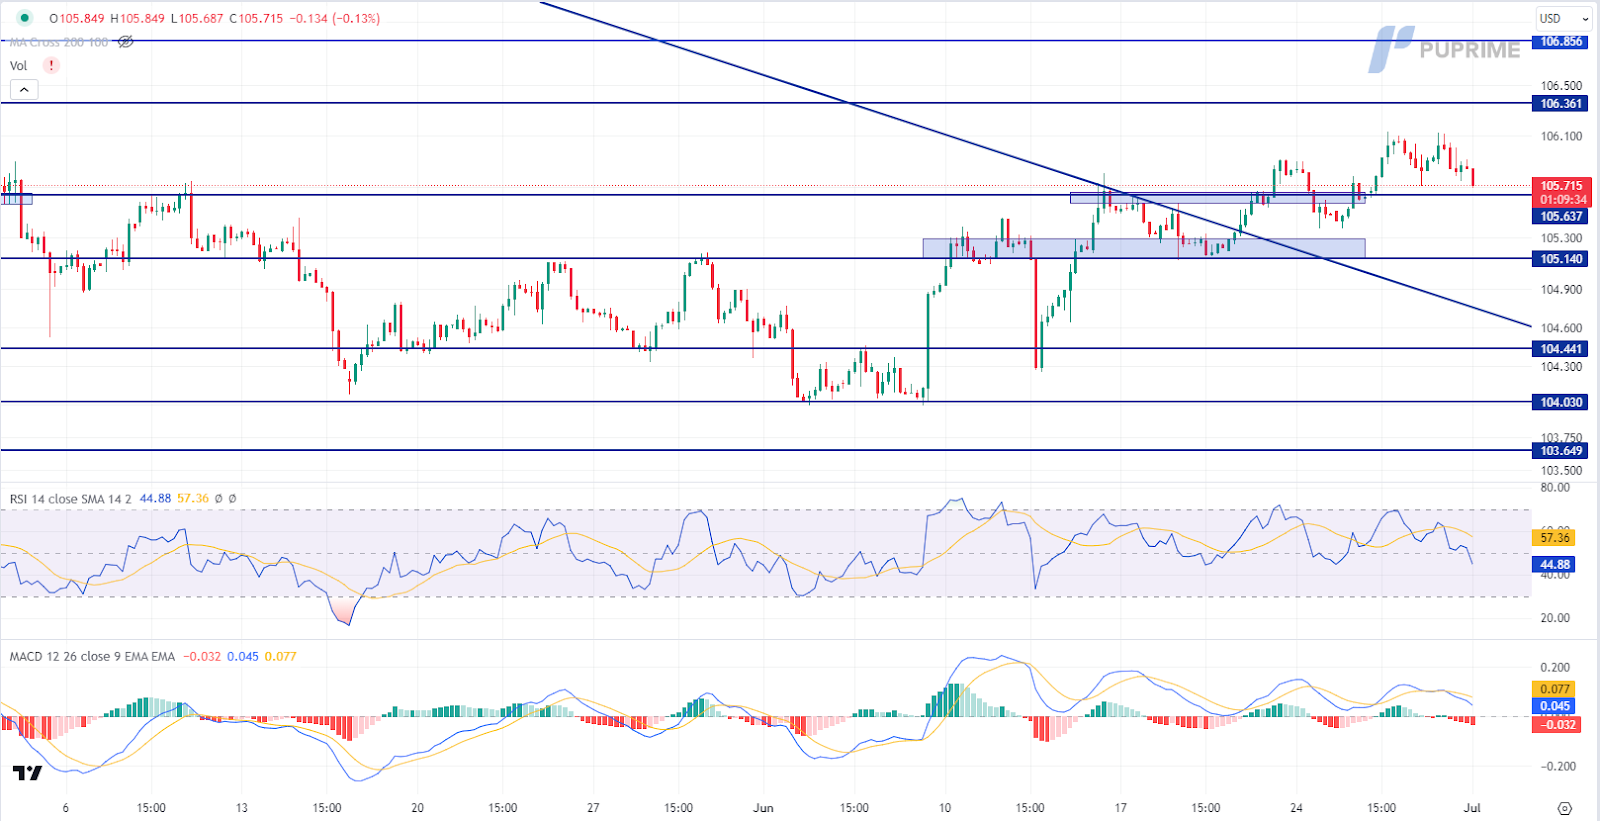
The Dollar Index, which trades against a basket of six major currencies, retreated slightly following the release of the latest inflation report, which showed a continued slowdown. According to the Bureau of Economic Analysis, the US Core PCE Price Index edged down from 2.80% to 2.60%, aligning with market expectations. This, along with the recent Consumer Price Index (CPI) and Producer Price Index (PPI), confirms a disinflationary trend in the United States. Market participants now expect the Federal Reserve might ease monetary policy by September, according to CME FedWatch Tools.
The Dollar Index is trading lower while currently testing the support level. MACD has illustrated increasing bearish momentum, while RSI is at 45, suggesting the index might extend its losses after breakout since the RSI stays below the midline.
Resistance level: 106.35, 106.85
Support level: 105.65, 105.15
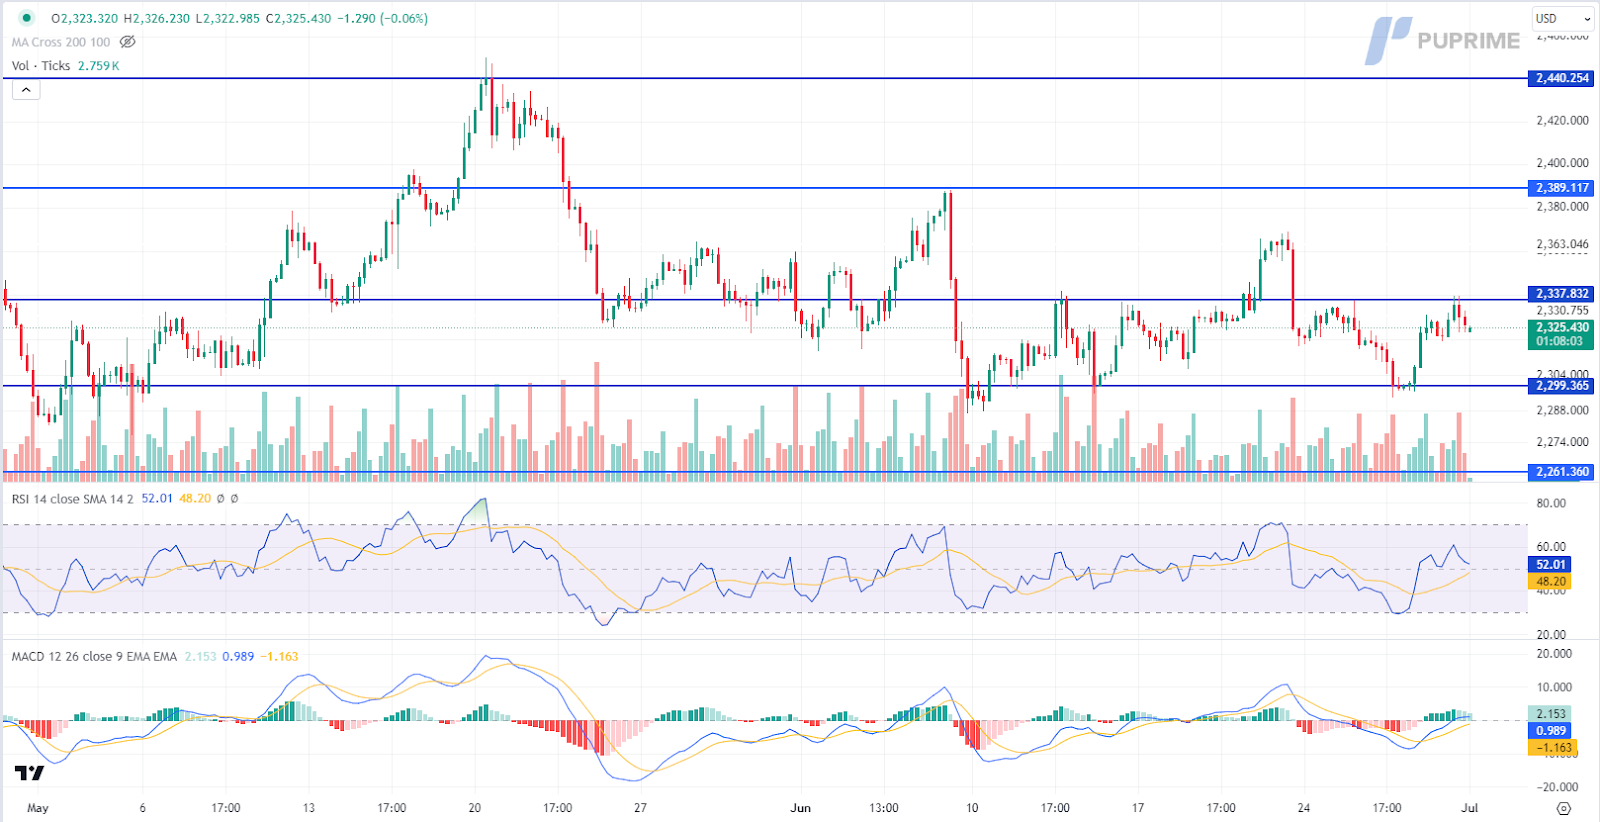
Gold prices surged initially following the release of easing US inflation data but retracted due to technical corrections and stronger-than-expected economic reports, including the Chicago PMI. The Chicago PMI rose significantly from 35.4 to 47.4, surpassing market expectations of 39.7, which limited gold’s gains. Despite this, uncertainties remain, and gold is likely to consolidate within a range until the US jobs report is released later this week.
Gold prices are trading lower following the prior retracement from the resistance level. MACD has illustrated diminishing bullish momentum, while RSI is at 52, suggesting the commodity might extend its losses since the RSI retreated sharply from overbought territory.
Resistance level: 2335.00, 2390.00
Support level: 2300.00, 2260.00
The GBP/USD pair has found support from its previous bearish trend and is currently attempting to break its previous high level. A successful break above this level would suggest a potential trend reversal for the pair. The Pound Sterling has been buoyed by the upbeat UK GDP data released last Friday, which provided positive momentum. Additionally, the pair edged higher due to the disappointing U.S. PCE reading, which came in line with market expectations, indicating that inflationary risks in the U.S. are mitigating.
GBP/USD has rebounded and is set to break above its previous high level, suggesting a potential trend reversal for the pair. The RSI hovers near the 50 level, while the MACD hovers below the zero line, suggesting a neutral signal for the pair.
Resistance level: 1.2760, 1.2850
Support level: 1.2600, 1.2540
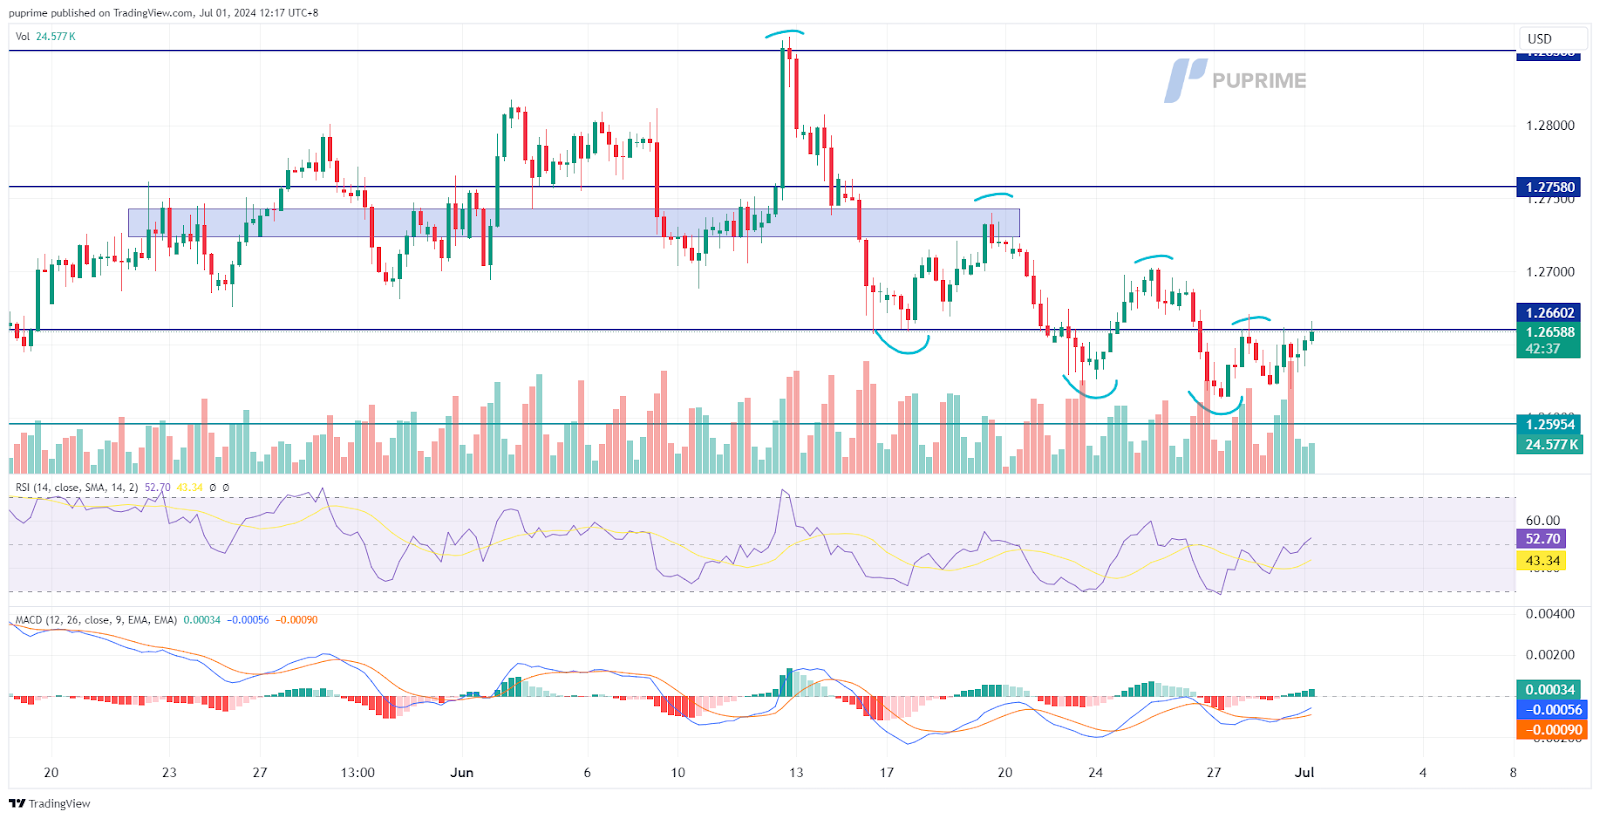
The Euro could see significant volatility later this week due to France’s snap election, with Marine Le Pen’s National Rally (RN) leading after the first round. The final outcome depends on party alignments for the second round, leading to days of negotiation before next Sunday’s runoff. Concerns about France’s rising debt crisis remain, and a National Rally victory, with its expansionary fiscal policy, could worsen the situation. The French bond market is tense, with high spreads and yields, prompting some investors to shift into the Euro. Market participants are bracing for high uncertainty and closely monitoring the situation for trading signals.
EUR/USD is trading higher while currently testing the resistance level. MACD has illustrated increasing bullish momentum, while RSI is at 60, suggesting the pair might extend its gains after breakout since the RSI stays above the midline.
Resistance level: 1.0735, 1.0810
Support level: 1.0675, 1.0615
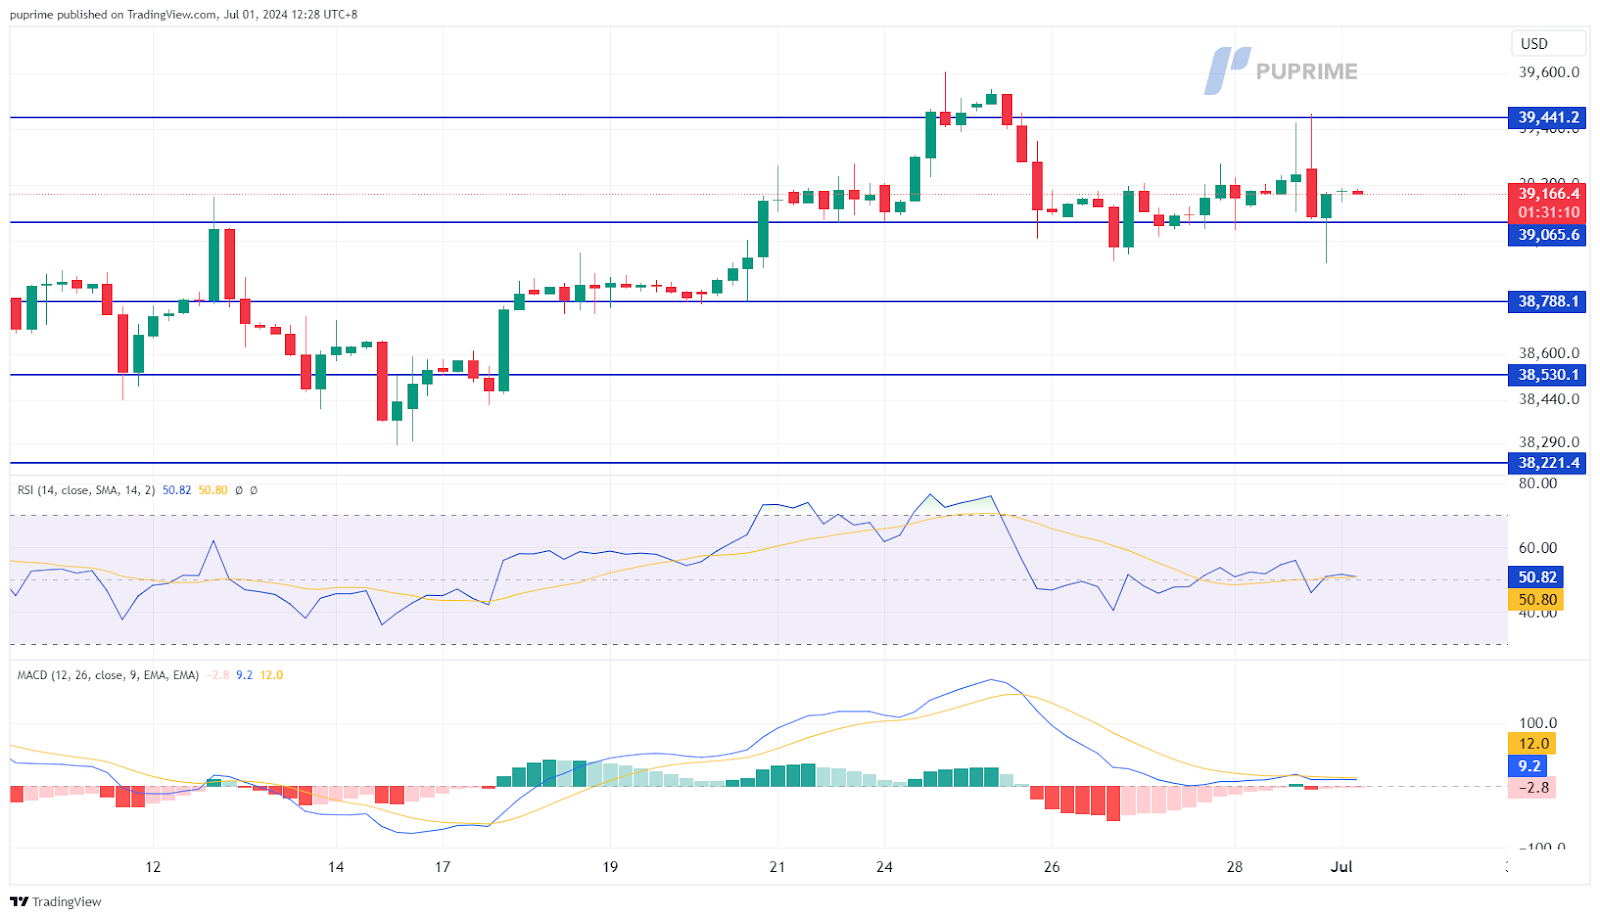
The Dow remained relatively muted in the last session as a surge in U.S. Treasury yields exerted downside pressure on equity markets, including the Dow. Traders also digested the previous Friday’s PCE readings, which came in line with market expectations. Despite the subdued performance, Dow Futures rose ahead of the market open in the U.S., suggesting that the index may edge higher in the upcoming New York session. This potential uptick indicates that investors are cautiously optimistic, anticipating a possible rebound despite the headwinds from rising yields.
The Dow traded mutedly in the last session, giving a neutral signal for the index. The RSI was flowing flat close to the 50 level, while the MACD has dropped to near the zero line, suggesting that the bullish momentum is vanishing.
Resistance level: 39440.00, 39815.00
Support level: 39065.00, 38790.00
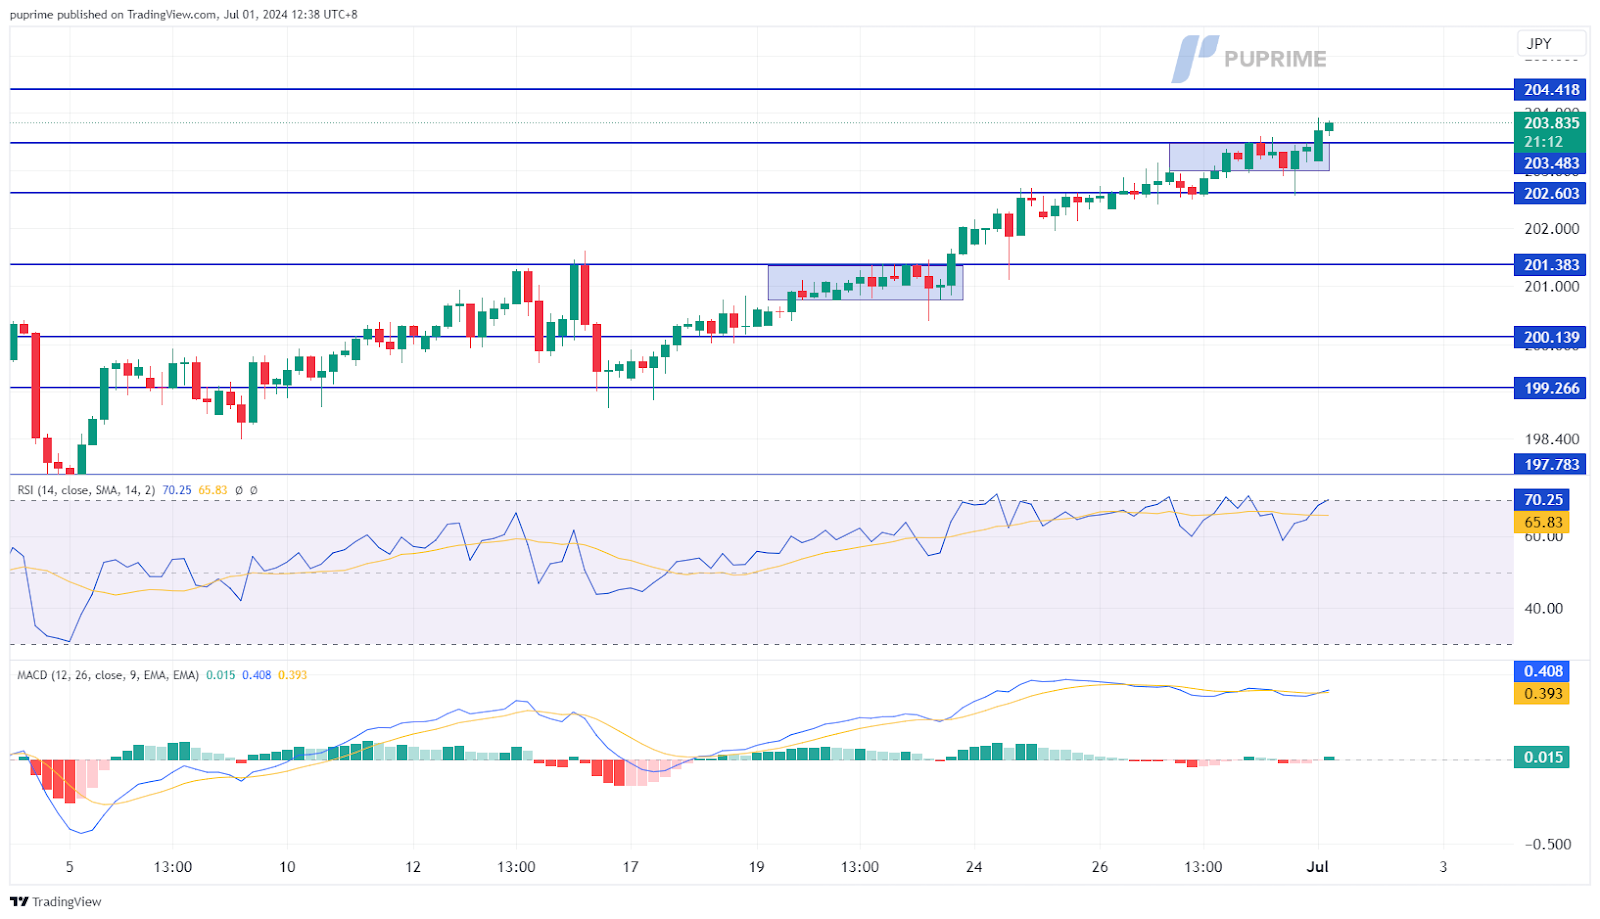
The GBP/JPY pair has surged to levels not seen since 2008, suggesting a bullish outlook for the pair. The Japanese Yen was briefly bolstered by the upbeat Tokyo CPI reading released last Friday, fueling speculation of a potential rate hike from the Bank of Japan at the end of July. However, the Yen remains under strong selling pressure, counteracted by the Pound Sterling’s strength. The Pound was significantly boosted by the robust UK GDP reading unveiled last Friday, pushing the pair to trade higher. As a result, the GBP/JPY pair reflects a complex interplay of factors, with the Pound’s momentum currently outweighing the transient support for the Yen.
The GBP/JPY pair remains trading in an uptrend trajectory, suggesting a bullish bias for the pair. The RSI has been hovering in the upper region, while the MACD remains at an elevated level, suggesting strong bullish momentum.
Resistance level: 204.45, 206.00
Support level: 203.50, 202.60
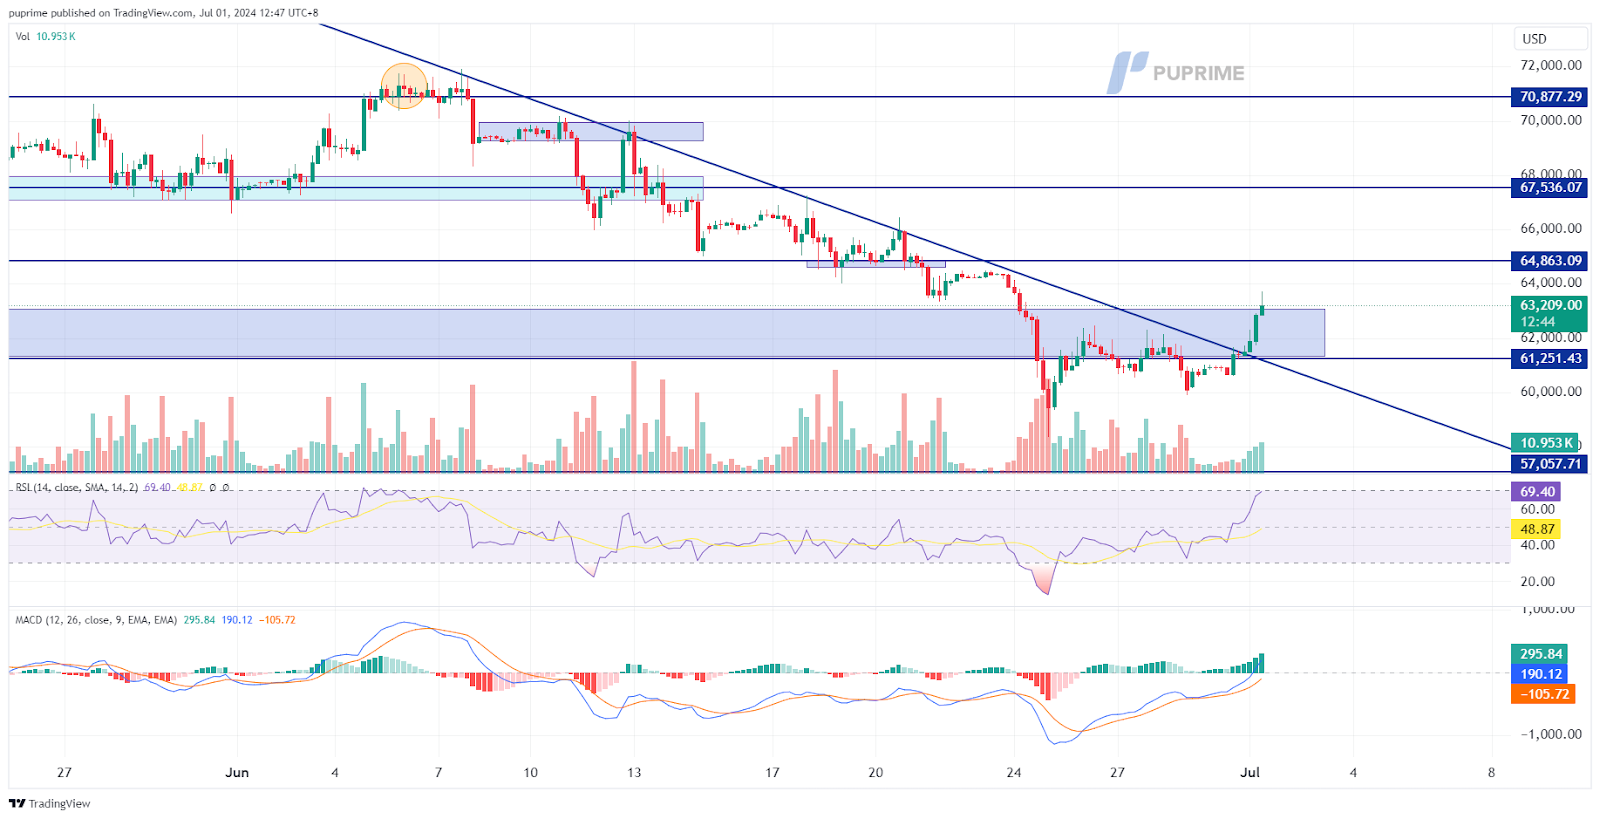
Bitcoin (BTC) experienced a sharp rise at the beginning of the week, climbing above the $63,000 level and suggesting a potential trend reversal for the cryptocurrency. The surge comes amid news that Sony Group has acquired Amber Japan, a digital asset trading services company, marking Sony’s entry into the crypto exchange market. This move by Sony is seen as a significant development in the crypto industry, potentially boosting market confidence. However, the optimistic sentiment is tempered by reports that the U.S. Securities and Exchange Commission (SEC) is delaying the launch of the ETH ETF until later this month.
BTC has risen sharply and is attempting to break above the current liquidity zone, suggesting a bullish bias for BTC. The RSI is on the brink of breaking into the overbought zone while the MACD is also to break above the zero line, suggesting the bullish momentum is forming.
Resistance level: 64850.00, 67540.00
Support level: 61250.00, 57060.00
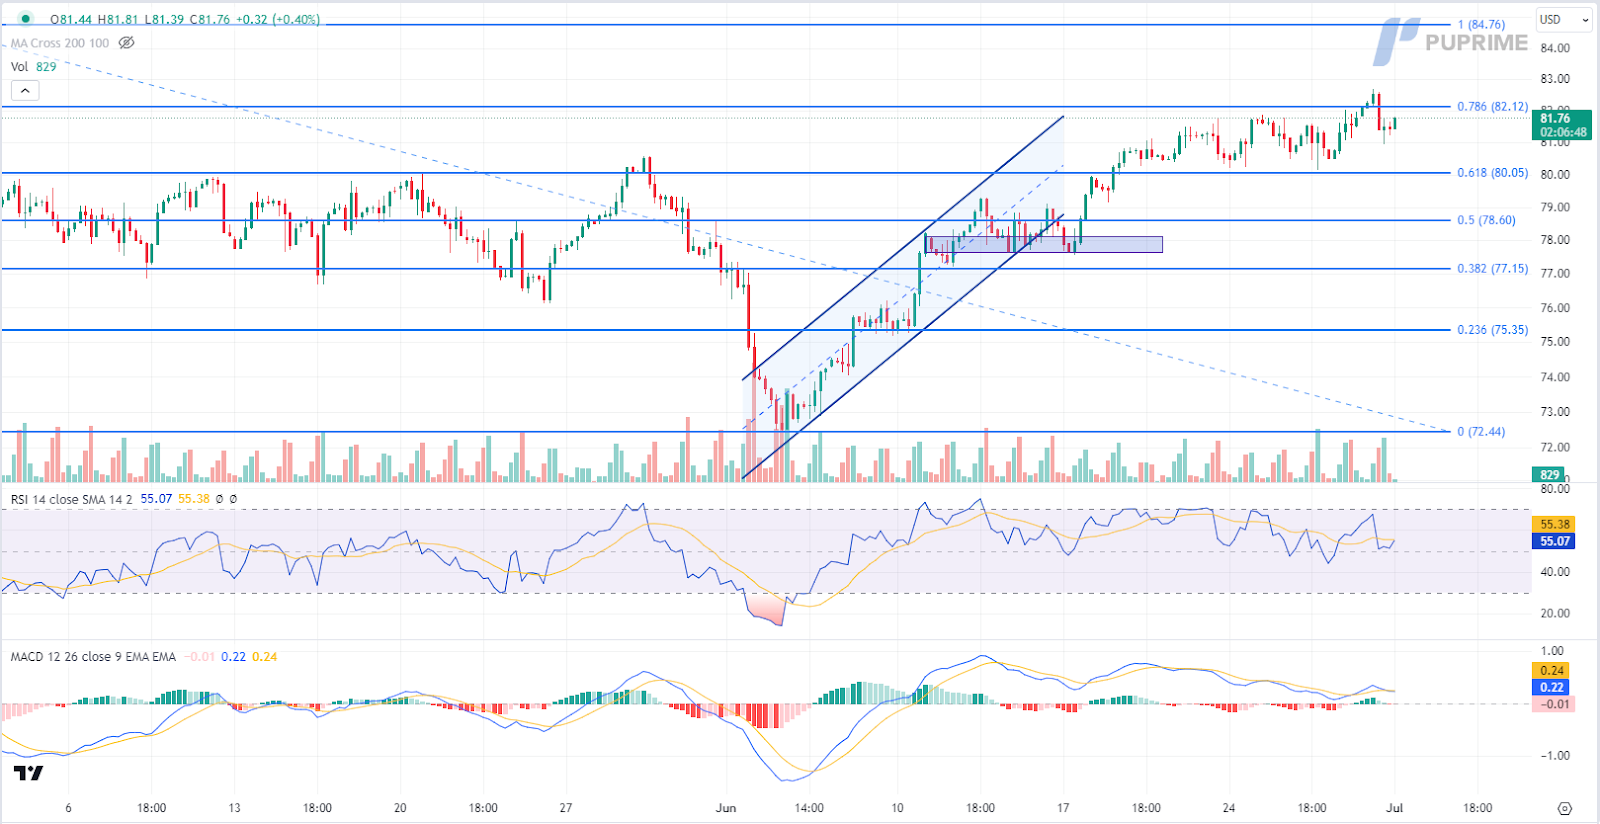
Oil prices retreated as investors digested weak US fuel demand and engaged in profit-taking, although the easing inflation report boosted chances of central bank rate cuts, limiting oil market losses. On a negative note, US oil production rose to a four-month high in April, while gasoline demand fell to 8.83 million barrels per day, the lowest level since February, according to the Energy Information Administration’s monthly report. Nonetheless, the flat reading of the US personal consumption expenditures (PCE) price index for May lifted hopes for rate cuts in September, potentially boosting oil prices.
Oil prices are trading flat while currently near the resistance level. MACD has illustrated increasing bullish momentum, while RSI is at 55, suggesting the commodity might extend its gains after breakout since the RSI stays above the midline.
Resistance level: 82.10, 84.75
Support level: 80.05, 78.60

Trade with simulated capital and earn real profits after you pass our trader assessment.

20 May 2025, 06:46 Gold Slips as Ceasefire Hopes Curb Safe-Haven Demand

7 May 2025, 03:59 Geopolitical Risks and FOMC Uncertainty Shake Global Markets

6 May 2025, 05:53 Dollar Dips, Gold Rallies on U.S.-Taiwan Risk


New Registrations Unavailable
We’re not accepting new registrations at the moment.
While new sign ups are unavailable, existing users can continue their challenges and trading activities as usual.
Disclaimer: This website exclusively provides proprietary trading services. We do not engage in any regulated activities, offer investment management services, or manage funds on behalf of external clients. Our trading activities are conducted solely with the firm's own capital, and we do not accept client deposits or manage client accounts. It's important to note that none of the services we provide should be construed as investment or financial services in accordance with applicable laws.
This website offers services related to professional skill and experience assessment, which determine your eligibility to trade with the firm's capital. The outcome of these services is inherently determined by your individual skill level and ability to perform within the trading requirements and objectives outlined for each service separately. Clients are strongly advised to thoroughly understand the requirements of the services before signing up for any.
The content provided on this website is for informational purposes only and does not constitute financial, investment, or trading advice. The information presented is based on sources believed to be reliable, but we do not guarantee its accuracy, completeness, or timeliness. We disclaim any liability for any loss or damage arising directly or indirectly from the use of or reliance on the information provided on this website.
This website is not directed to residents of certain jurisdictions such as the United States, Singapore, Australia, China and some other specified regions, and is not intended for distribution to, or use by, any person in any countries or jurisdictions where such distribution or use would be contrary to local law or regulation.
This website is owned by Finzero Cap Ltd, a company incorporated in the Republic of Cyprus under registration number HE414308, with its registered office at 62 Athalassas, Mezzanine, Strovolos 2012, Nicosia, Cyprus. Finzero Cap Ltd serves as the authorized representative for PU Prime Ltd.
