Join the PU Xtrader Challenge Today
Trade with simulated capital and earn real profits after you pass our trader assessment.
Join the PU Xtrader Challenge Today
Trade with simulated capital and earn real profits after you pass our trader assessment.
5 October 2023,05:44
Daily Market Analysis
5 October 2023, 05:44
The US dollar faced a setback, plunging below the pivotal $107 threshold, following lacklustre private-sector job data showing a mere 89,000 increase in employment last month, marking its lowest figure since September 2021. This unexpected dip in the dollar’s strength triggered a technical rebound in the U.S. equity markets. Meanwhile, the Japanese Yen capitalised on the weakening dollar, prompting speculation about potential intervention by Japanese authorities. The Yen’s rise was spurred by dismal employment figures from the United States, intensifying market scrutiny. Additionally, oil markets suffered a blow as official US data revealed the weakest seasonal demand for oil in decades, leading to the most significant drop in oil prices in 2023.
Current rate hike bets on 1st November Fed interest rate decision:
Source: CME Fedwatch Tool
0 bps (72.0%) VS 25 bps (28%)
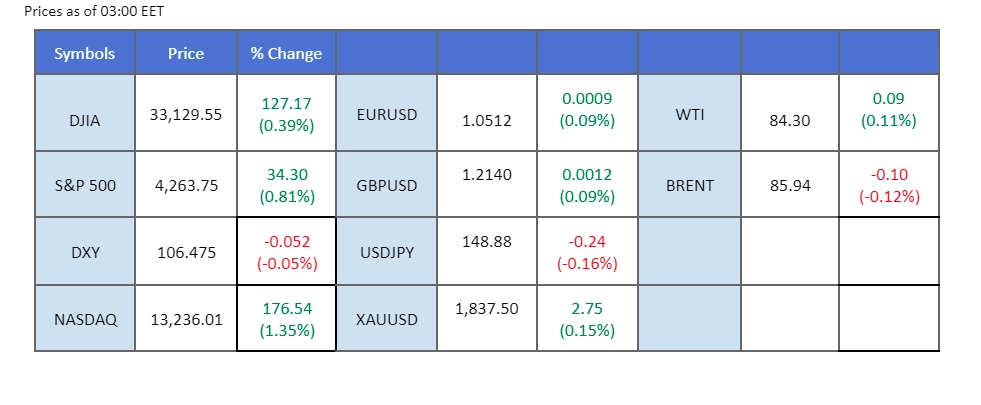
The US Dollar faced a downward trajectory, weighed down by a series of bearish economic indicators, signalling a prevailing sense of pessimism in the US economy. The discouraging data has cast doubt on the possibility of another interest rate hike by the Federal Reserve. Specifically, the US ADP Nonfarm Employment Change saw a significant decline from 180,000 to 89,000, falling short of market expectations at 153,000. However, the US S&P Global Composite Purchasing Managers Index (PMI) performed slightly better than anticipated, coming in at 50.2, surpassing the market’s outlook of 50.1.
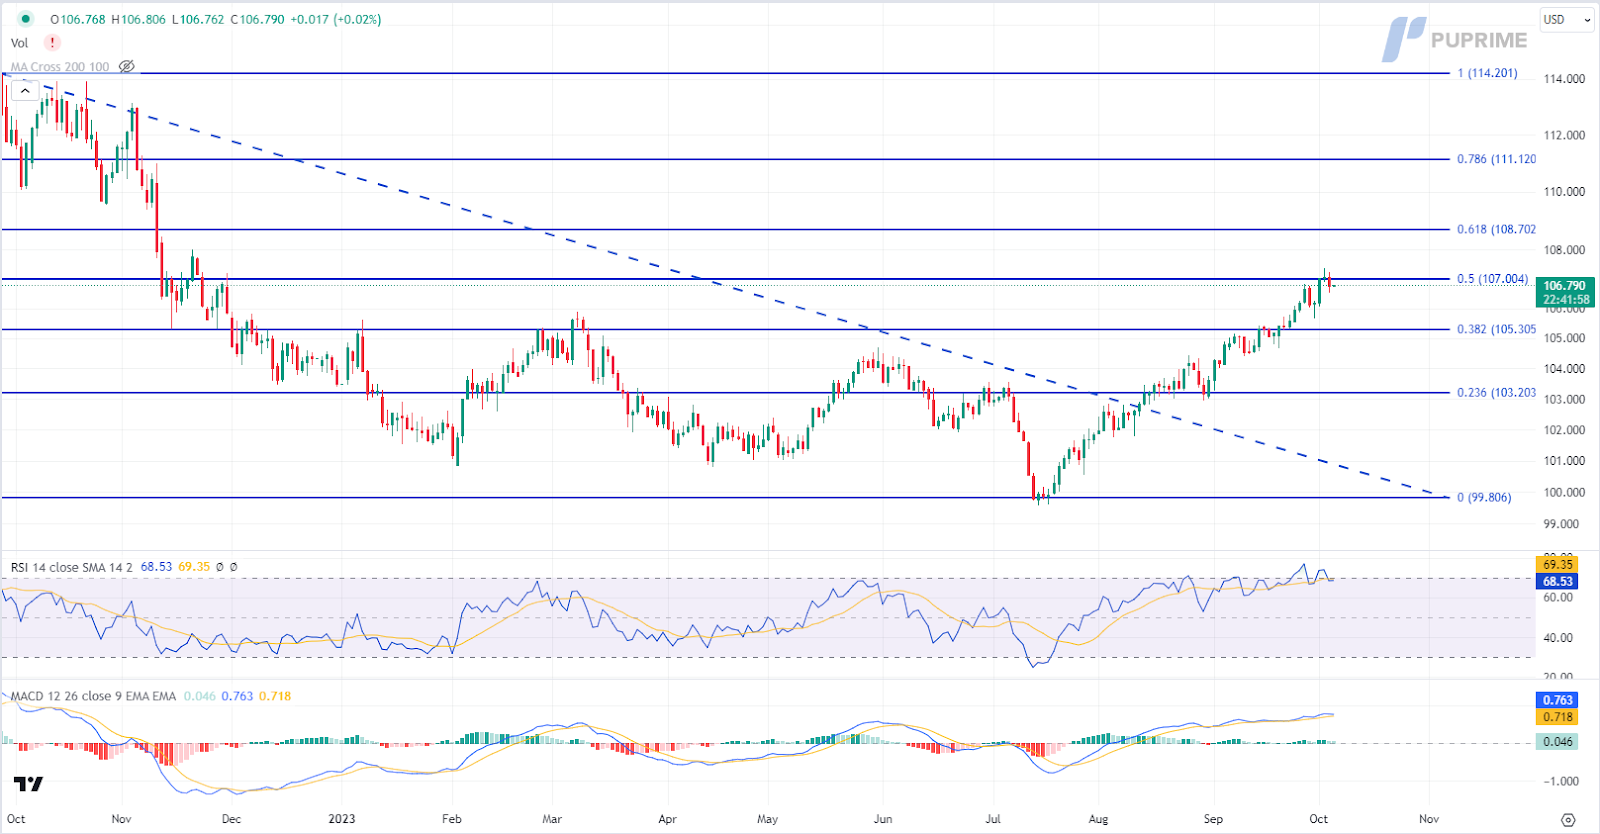
The Dollar Index is trading higher while currently testing the resistance level. MACD has illustrated diminishing bullish momentum, while RSI is at 69, which suggests the index might enter overbought territory.
Resistance level: 107.00, 108.70
Support level: 105.30, 103.20
The gold market continued to grapple with negative sentiment, although the bearish momentum has shown signs of abating in anticipation of critical US jobs data. Additionally, the influx of downbeat economic data from the US weighed on the US Dollar, providing an extra layer of bullish momentum to the gold market.
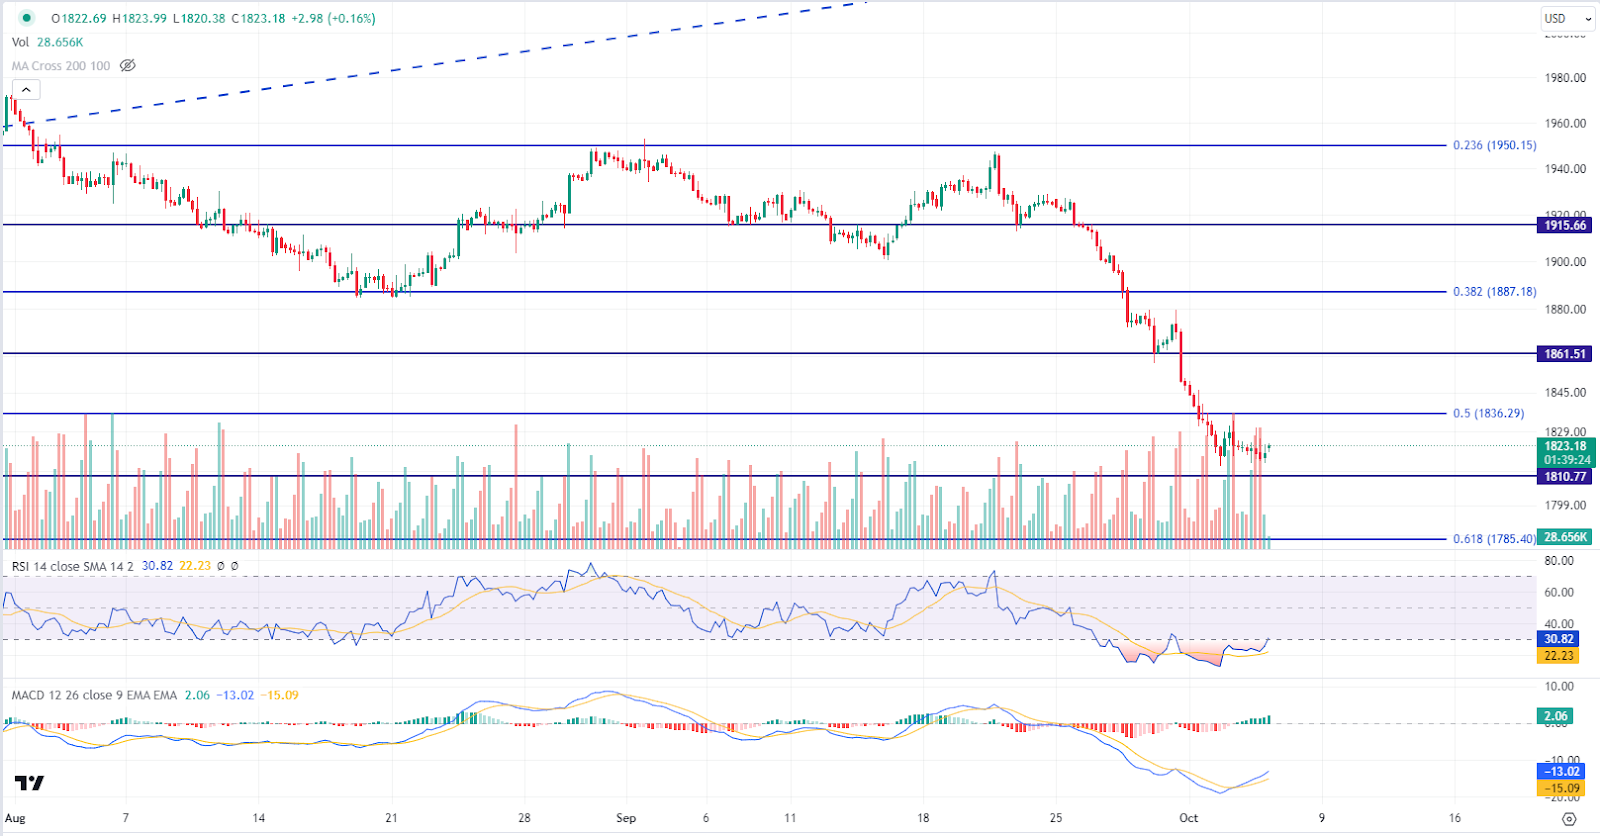
Gold prices are trading lower following the prior breakout below the previous support level. However, MACD has illustrated diminishing bearish momentum, while RSI is at 30, suggesting the commodity might enter oversold territory.
Resistance level: 1835.00, 1860.00
Support level: 1810.00, 1785.00

Surprisingly, the euro staged a notable recovery, surging above the 1.0500 mark. The dollar faced pressure following lacklustre U.S. job data, causing the dollar index to slip below $107. All eyes are now on the upcoming NonFarm Payroll report slated for release on Friday, a key event anticipated by investors. Adding to the euro’s strength, positive economic signals emerged from the Eurozone. German Service PMI crossed the crucial 50-mark threshold, indicating growth, while Eurozone PMIs surpassed market expectations. These encouraging indicators fueled the euro’s upward trajectory, painting a positive picture amid global market fluctuations.
Despite the pair having a technical rebound and both the RSI and the MACD indicating that the bearish momentum has eased, the pair is still trading in a bearish momentum.
Resistance level: 1.0550, 1.0620
Support level: 1.0470, 1.0340
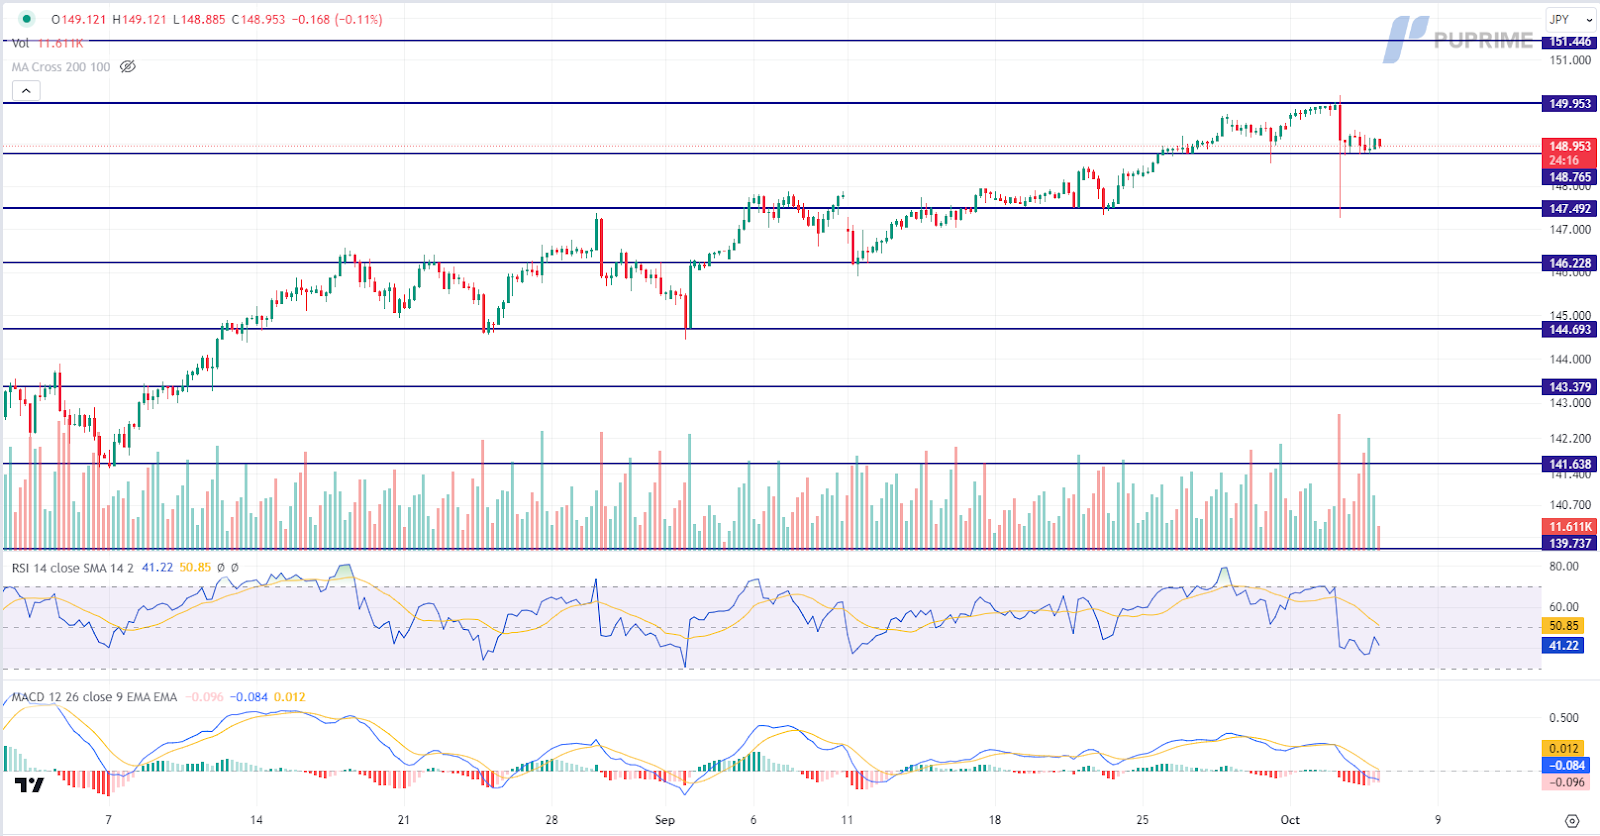
The Japanese yen maintained a consolidative stance near key support levels, as investors adopted a cautious “wait and see” approach. This mood is driven by both the upcoming US Jobs report and expectations of potential currency intervention by the Bank of Japan. To navigate potential volatilities, investors are treading carefully in the Japanese yen market..
USD/JPY is trading lower while currently near the support level. However, MACD has illustrated diminishing bearish momentum, while RSI is at 41, suggesting the pair might experience technical correction since the RSI rebounded sharply from oversold territory.
Resistance level: 149.95, 151.45
Support level: 148.75, 147.50
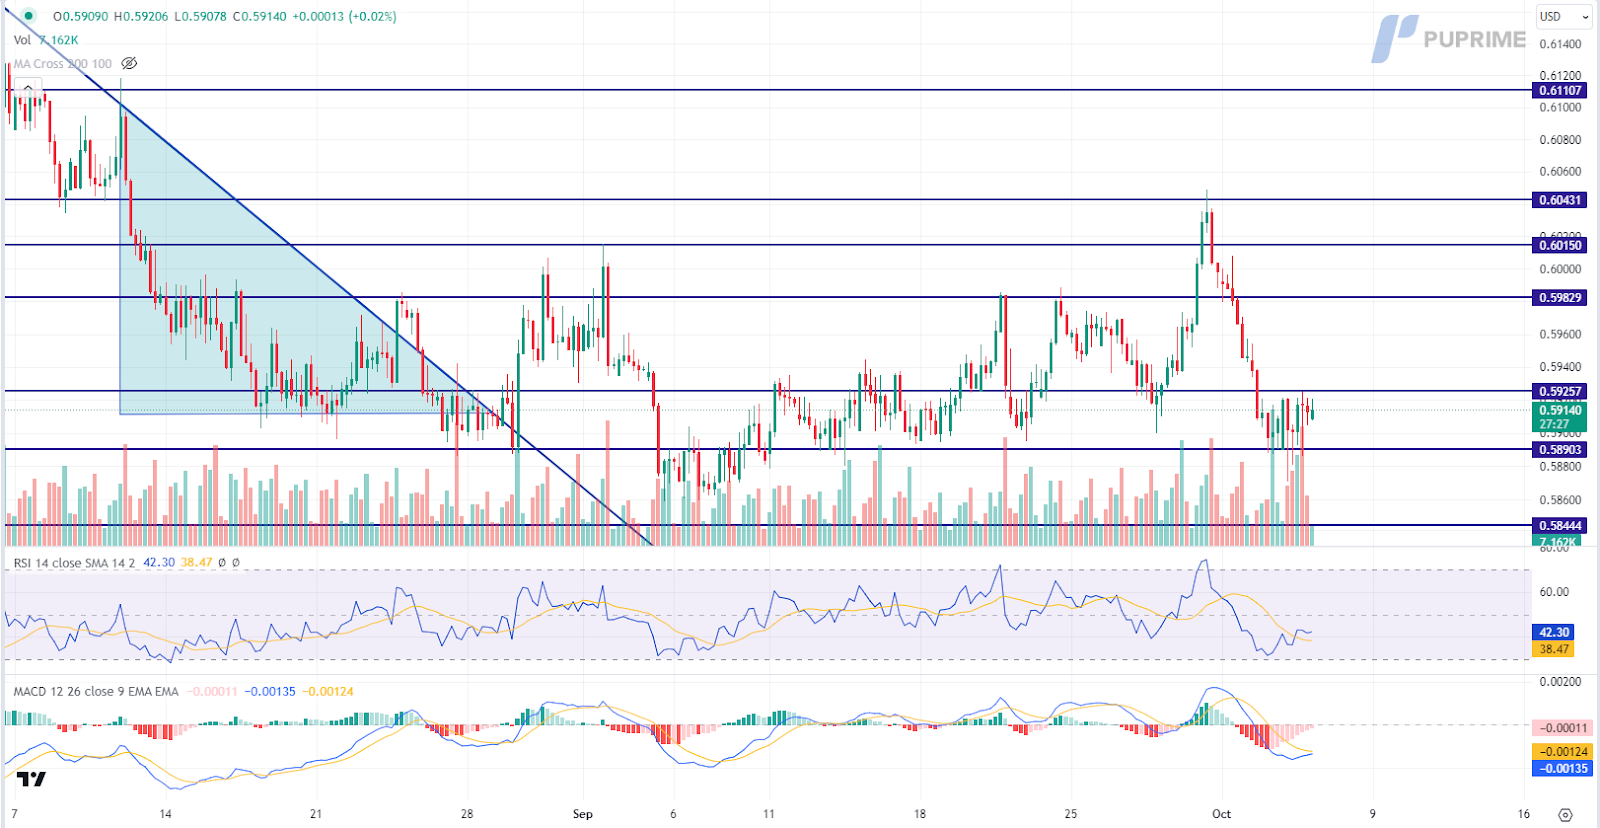
The New Zealand Dollar exhibited a flat performance following the Reserve Bank of New Zealand’s (RBNZ) monetary policy decisions. The Monetary Policy Committee (MPC) opted to keep the official cash rate (OCR) unchanged at 5.50%, as widely anticipated. However, the MPC’s outlook highlighted expectations of declining inflation within the target band by the second half of 2024. Recent employment indicators remained stagnant, with decreased labor scarcity. These downbeat economic forecasts have dampened the appeal of the NZD.
NZD/USD is trading flat while currently near the resistance level. MACD has illustrated diminishing bearish momentum, while RSI is at 42, suggesting the pair might extend its gains after breakout the resistance level.
Resistance level: 0.5925, 0.5985
Support level: 0.5890, 0.5845
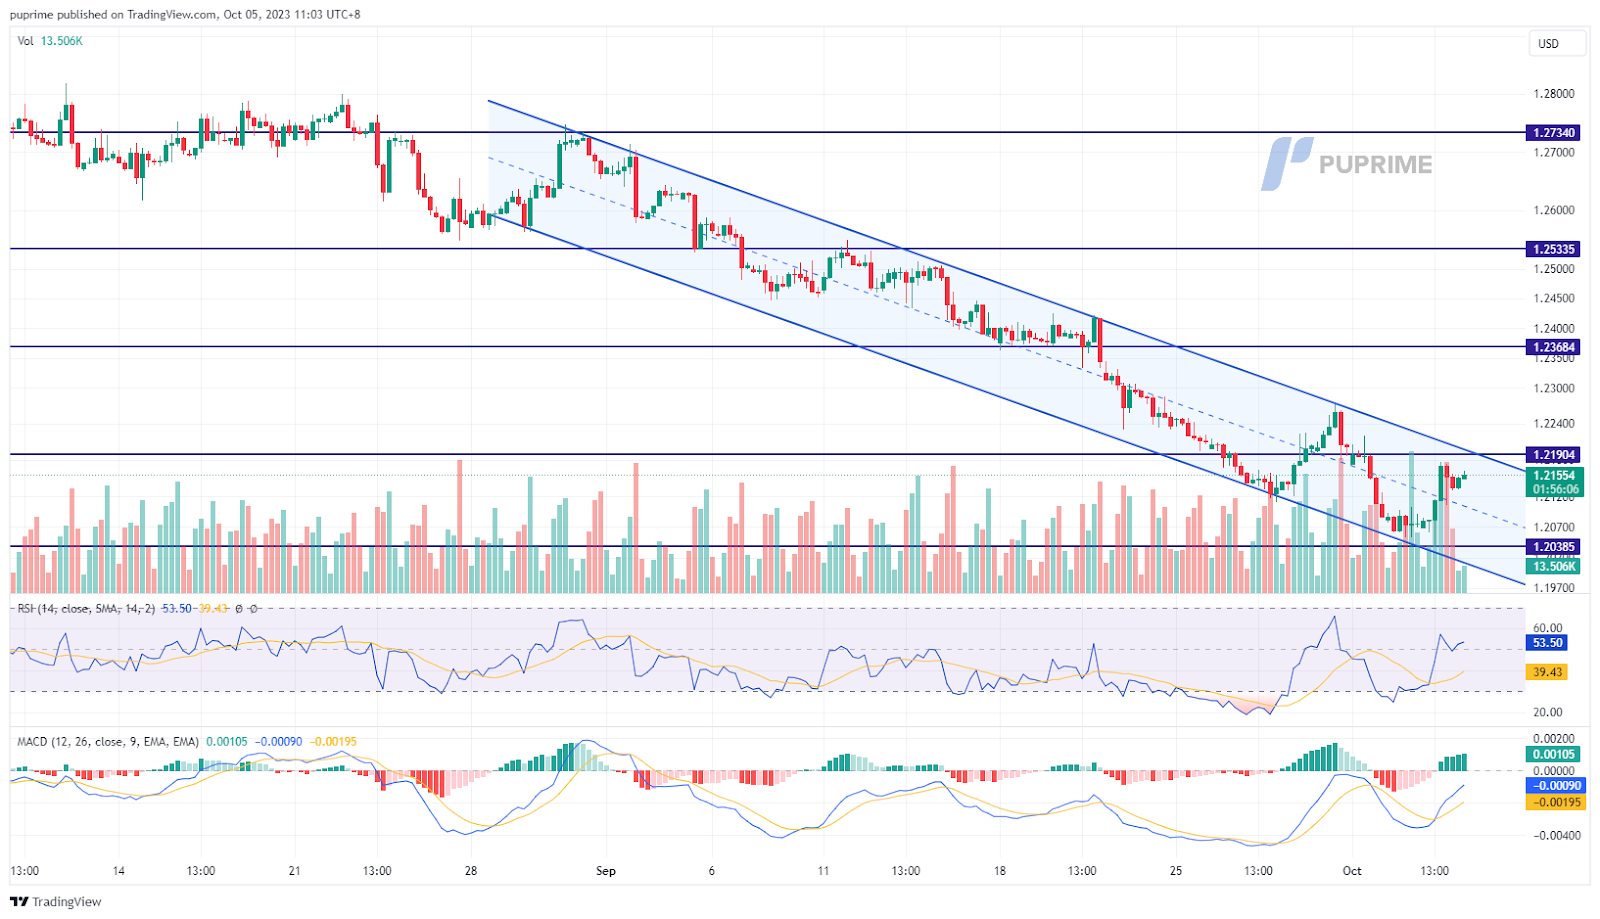
Despite recent technical rebounds, the pound sterling remains within a downtrend channel. The UK’s PMI delivered better-than-expected readings compared to the previous month, offering some support to the sterling against the robust dollar. Concurrently, the dollar’s strength was dampened by disappointing job data, marking its lowest figures since September 2021. These contrasting dynamics continue to shape the forex landscape, highlighting the delicate balance between economic indicators and market sentiment
The Cable has rebounded from its lowest level since March but still trades within the downtrend channel. The RSI has rebounded sharply while the MACD has crossed at below the zero line, both indicators suggesting a trend reversal for the Cable.
Resistance level: 1.2190, 1.2370
Support level: 1.2040, 1.1940
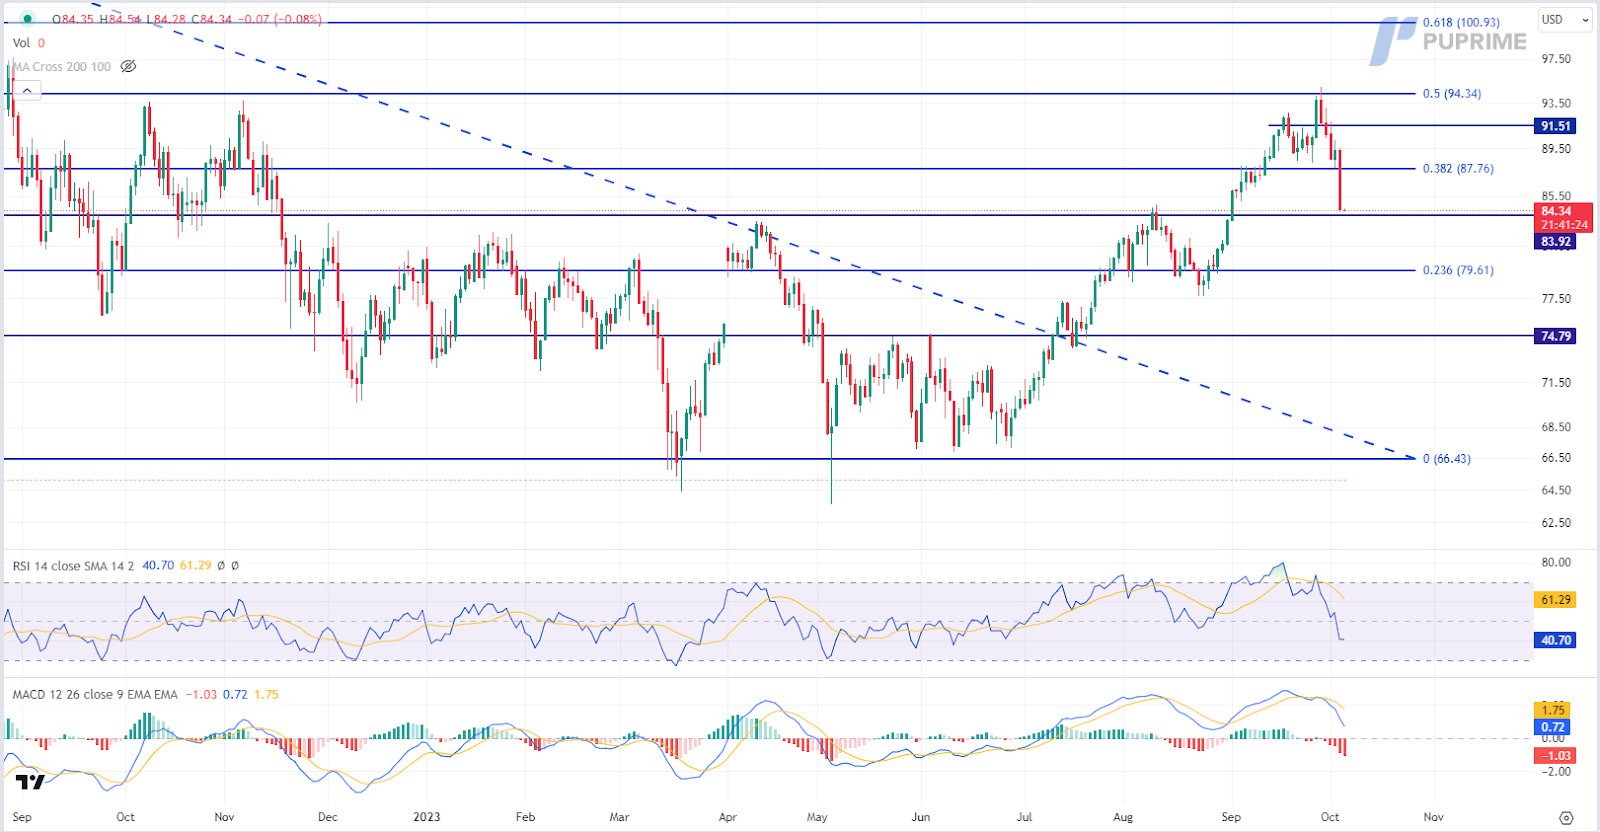
Oil prices faced downward pressure as a pessimistic economic outlook weighed on oil demand. Both the US and the UK witnessed a gloomy economic sentiment, marked by a disappointing ADP report in the US and the UK’s weakest service sector performance in eight months in September, as reported by S&P Global.
Oil prices are trading lower while currently testing the support level. MACD has illustrated increasing bearish momentum, while RSI is at 41, suggesting the commodity might extend its losses after breakout since the RSI stays below the midline.
Resistance level: 87.75, 91.50
Support level: 83.90, 79.60

Trade with simulated capital and earn real profits after you pass our trader assessment.

20 May 2025, 06:46 Gold Slips as Ceasefire Hopes Curb Safe-Haven Demand

7 May 2025, 03:59 Geopolitical Risks and FOMC Uncertainty Shake Global Markets

6 May 2025, 05:53 Dollar Dips, Gold Rallies on U.S.-Taiwan Risk


New Registrations Unavailable
We’re not accepting new registrations at the moment.
While new sign ups are unavailable, existing users can continue their challenges and trading activities as usual.
Disclaimer: This website exclusively provides proprietary trading services. We do not engage in any regulated activities, offer investment management services, or manage funds on behalf of external clients. Our trading activities are conducted solely with the firm's own capital, and we do not accept client deposits or manage client accounts. It's important to note that none of the services we provide should be construed as investment or financial services in accordance with applicable laws.
This website offers services related to professional skill and experience assessment, which determine your eligibility to trade with the firm's capital. The outcome of these services is inherently determined by your individual skill level and ability to perform within the trading requirements and objectives outlined for each service separately. Clients are strongly advised to thoroughly understand the requirements of the services before signing up for any.
The content provided on this website is for informational purposes only and does not constitute financial, investment, or trading advice. The information presented is based on sources believed to be reliable, but we do not guarantee its accuracy, completeness, or timeliness. We disclaim any liability for any loss or damage arising directly or indirectly from the use of or reliance on the information provided on this website.
This website is not directed to residents of certain jurisdictions such as the United States, Singapore, Australia, China and some other specified regions, and is not intended for distribution to, or use by, any person in any countries or jurisdictions where such distribution or use would be contrary to local law or regulation.
This website is owned by Finzero Cap Ltd, a company incorporated in the Republic of Cyprus under registration number HE414308, with its registered office at 62 Athalassas, Mezzanine, Strovolos 2012, Nicosia, Cyprus. Finzero Cap Ltd serves as the authorized representative for PU Prime Ltd.
