Join the PU Xtrader Challenge Today
Trade with simulated capital and earn real profits after you pass our trader assessment.
Join the PU Xtrader Challenge Today
Trade with simulated capital and earn real profits after you pass our trader assessment.
11 July 2024,03:33
Daily Market Analysis
11 July 2024, 03:33
* Dollar’s strength is dragged by the dovish narrative of Powell’s 2-days testimony.
*Wall Street rallied as the risk-on sentiment heightened in the market.
*Eyeing on today’s U.S. CPI reading to gauge the dollar’s direction.
Jerome Powell’s two-day testimony before the Senate concluded yesterday, with a dovish tone that bolstered the market’s risk-on sentiment and tempered the dollar’s strength amidst expectations of accommodative monetary policy. Wall Street continued its rally as the U.S. equity market entered earnings season, buoyed by optimistic outlooks for corporate earnings. Attention now turns to the U.S. CPI data scheduled for release later today, which will likely influence both the direction of the dollar and Wall Street’s response.
Meanwhile, the Pound Sterling has shown strength recently, with today’s UK GDP release poised to potentially lift the currency higher if the data surpasses market expectations. In the commodity markets, although gold has been trading upward, its gains are tempered by the prevailing risk-on sentiment. Conversely, oil prices have been stimulated by the optimistic OPEC monthly report, which forecasts increased demand in the second half of the year, providing support for oil prices.
Current rate hike bets on 31st July Fed interest rate decision:
Source: CME Fedwatch Tool
0 bps (95.3%) VS -25 bps (4.7%)
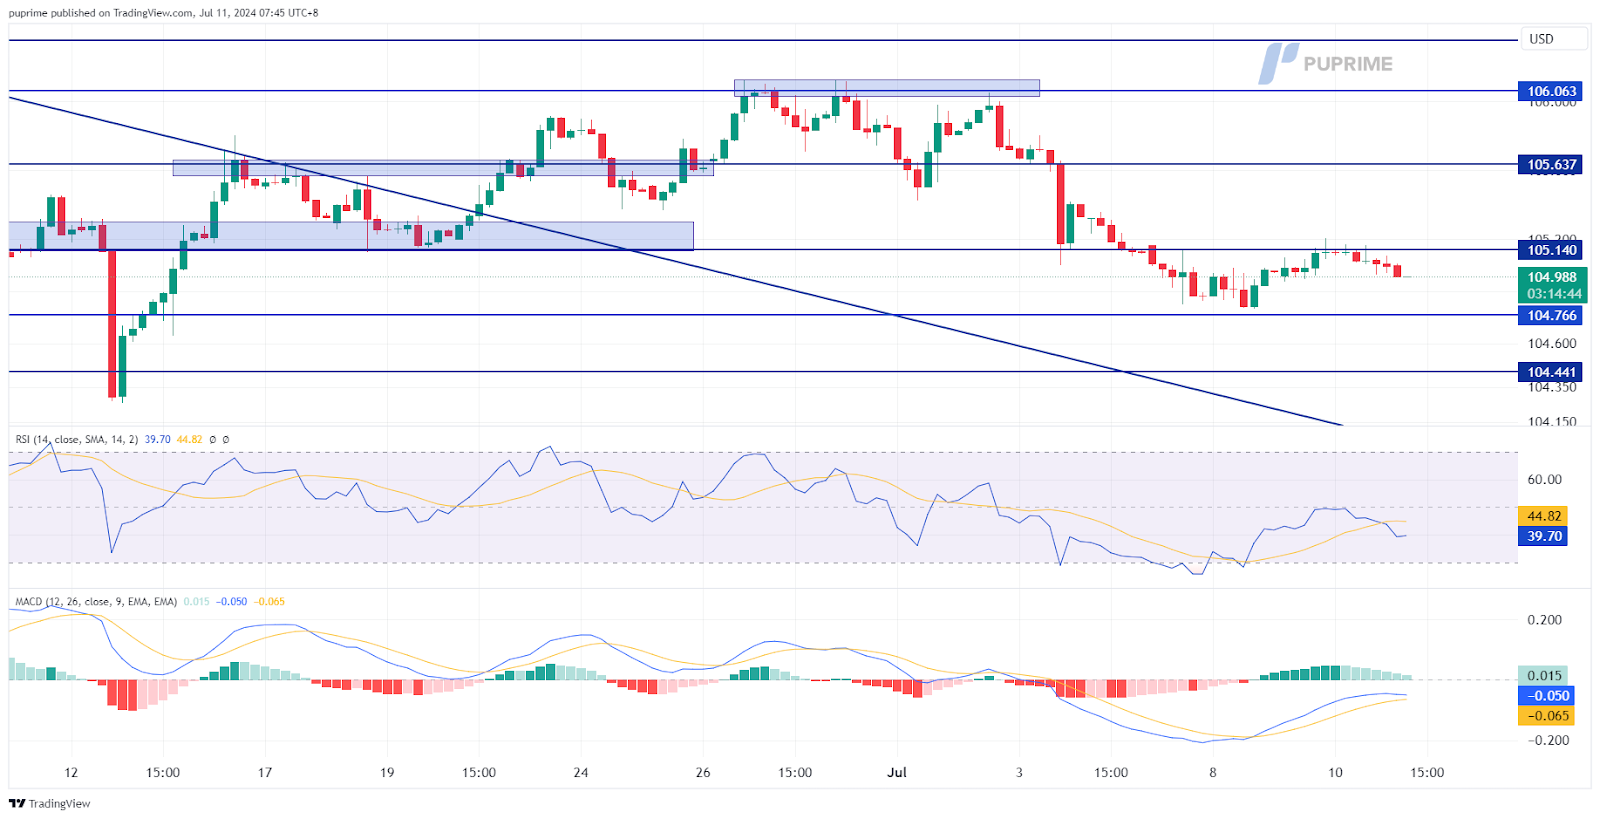
The Dollar Index failed to break above its next resistance level and edged lower following the conclusion of Jerome Powell’s two-day testimony. The Fed Chair did not dissuade the market from speculating on a rate cut this year, with current predictions pointing to the first cut occurring in September. The fixed asset market remained stable, while treasury yields declined amid growing dovish speculation on the Fed.
The Dollar index ended its technical rebound at 105.15 and is edging lower, suggesting a lack of momentum. The RSI is kept below the 50 level, while the MACD has not broken above the zero line, suggesting that the bearish momentum is overwhelming.
Resistance level: 105.15, 105.50
Support level: 104.75, 104.40
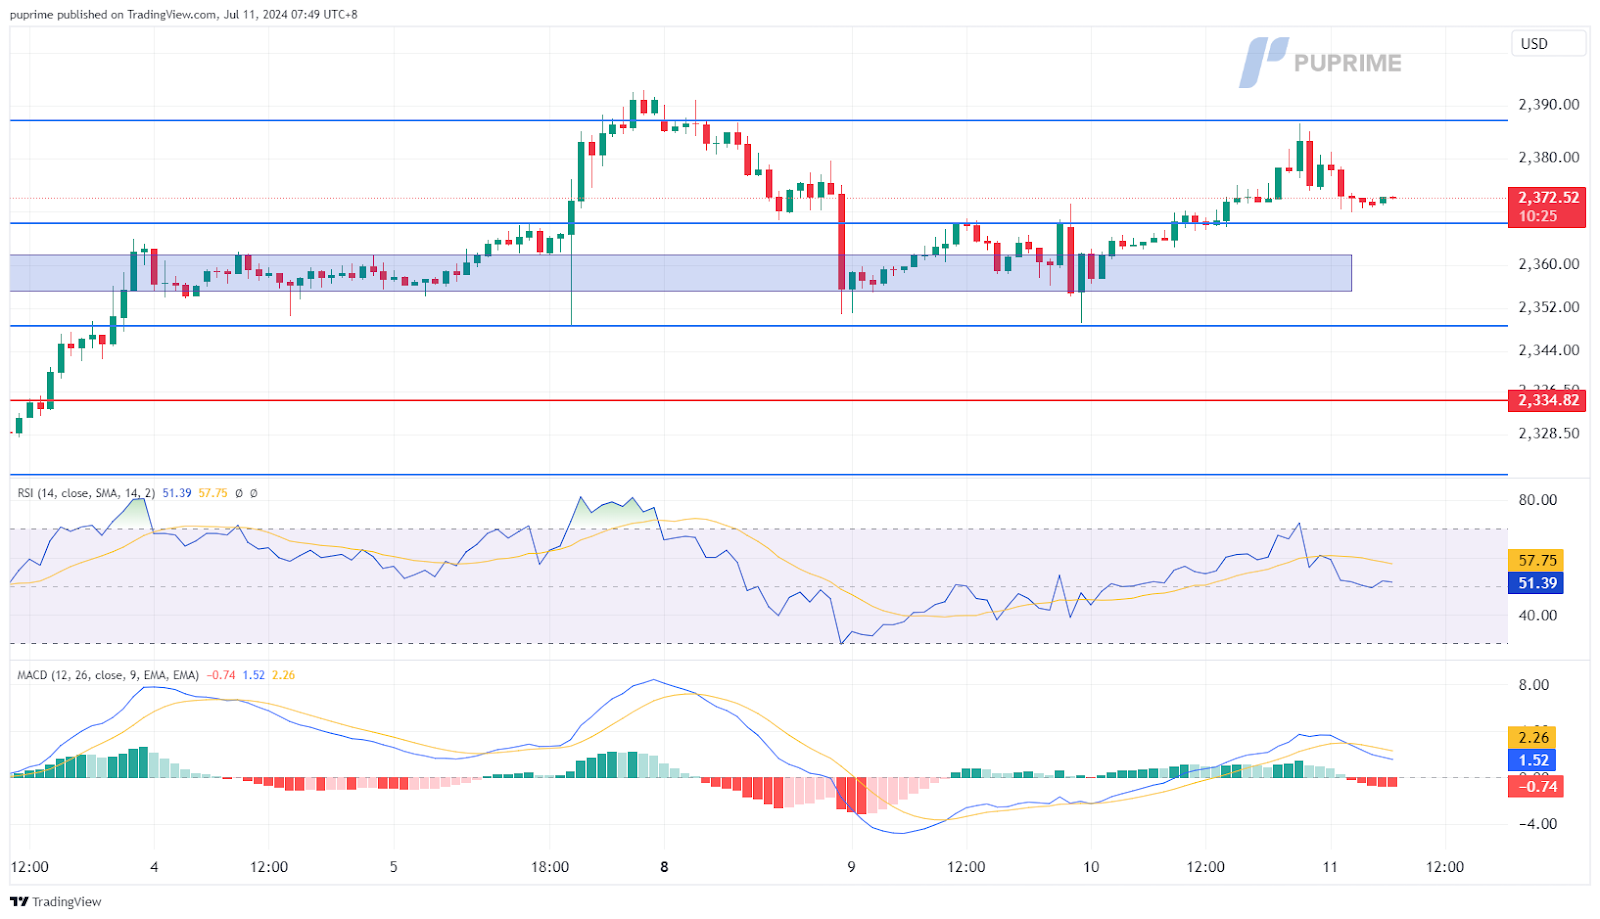
Gold prices have rebounded from the liquidity zone, suggesting that gold remains in its bullish trajectory. However, heightened risk-on sentiment in the market has weighed on gold as a safe-haven asset. If gold fails to break above the $2,390 level and forms a double-top price pattern, it would signal a potential trend reversal for the precious metal.
Notwithstanding that gold had a technical retracement followed by a rebound from its crucial support level, it is able to be supported above the 2370 level, suggesting that the bullish momentum remains intact with the gold. The RSI has declined from the overbought zone while the MACD has crossed, suggesting the bullish momentum is easing.
Resistance level: 2388.00, 2400.00
Support level:2368.00, 2350.00
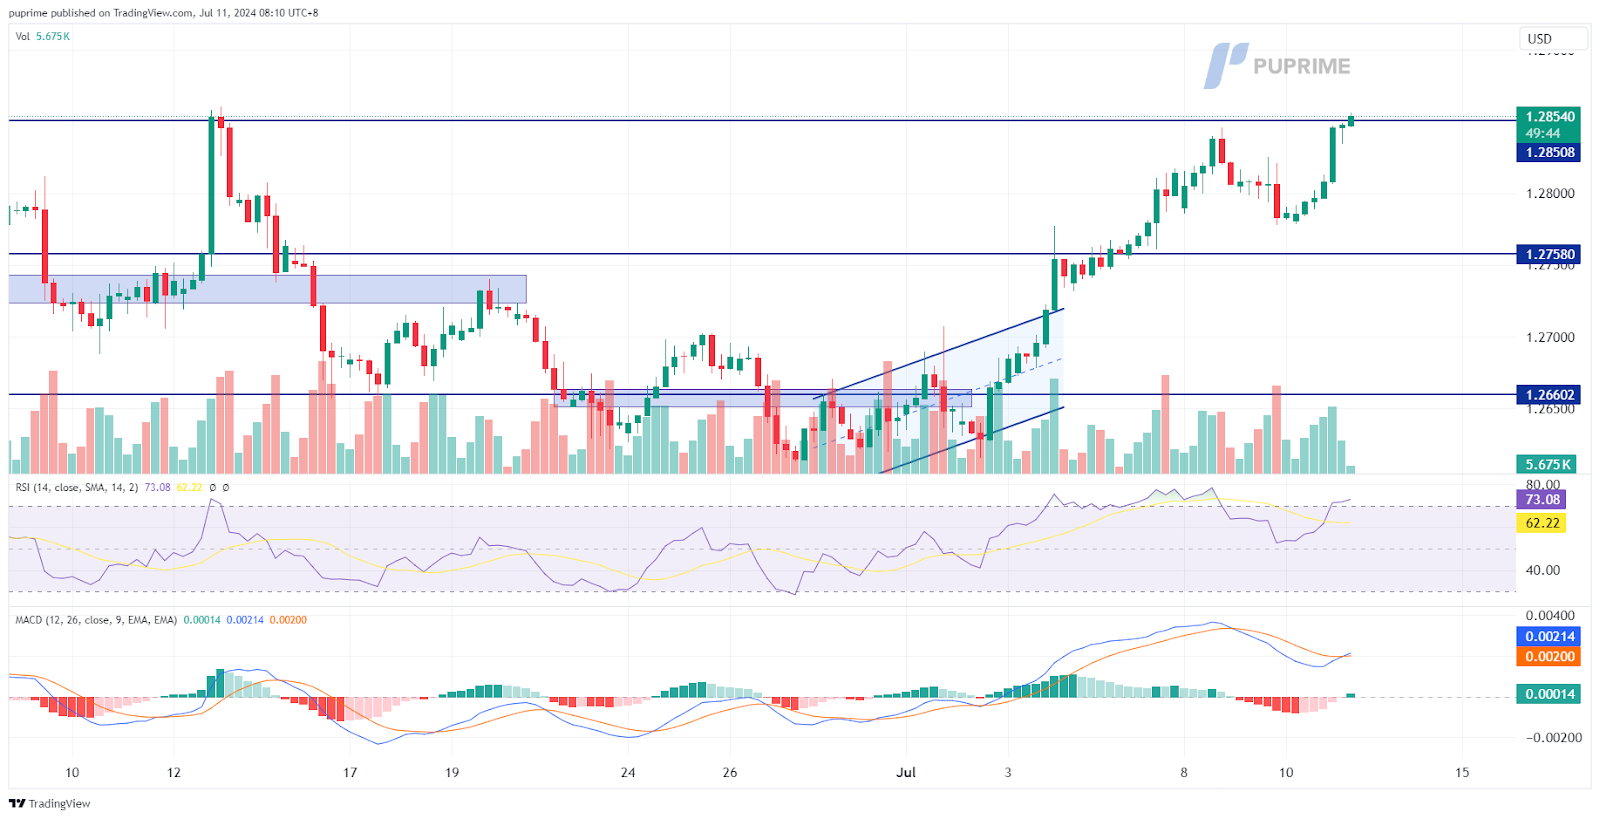
The GBP/USD pair has risen to its highest level since last month. A break above the current level suggests a bullish signal for the pair. Pound Sterling traders should pay attention to the UK’s GDP reading due later today; an upbeat reading could be the catalyst for the Sterling to break above its current resistance level.
The GBP/USD pair rebounded sharply after a technical retracement, suggesting a bullish signal for the pair. The RSI has gained back into the overbought zone, while the MACD has a sign to rebound above the zero line, suggesting that the bullish momentum remains strong.
Resistance level: 1.2940, 1.3000
Support level: 1.2760, 1.2660
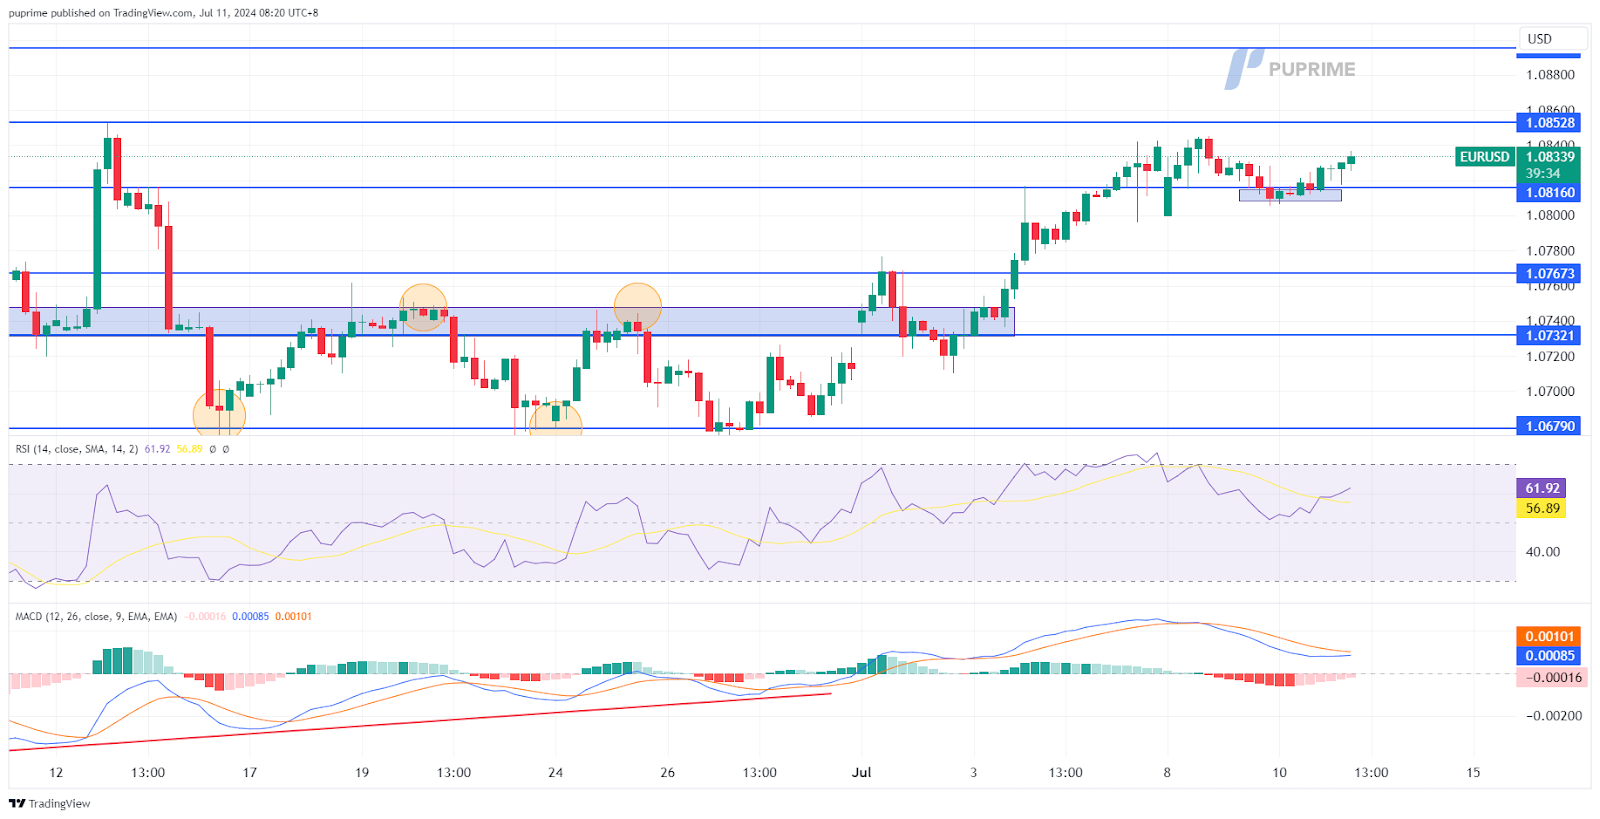
The EUR/USD pair has found support at the liquidity zone at the 1.0811 level and rebounded from this area. Despite political uncertainty weighing on the euro’s strength, the pair found support due to the lacklustre dollar. Today’s U.S. CPI reading will be a pivotal point for the pair’s direction.
EUR/USD is consolidating in a wide range after a rally, suggesting the bullish momentum remains intact with the pair. The RSI stays in the upper region while the MACD is flowing above the zero line, suggesting the pair is trading with bullish momentum.
Resistance level: 1.0853, 1.0900
Support level: 1.0767, 1.0735
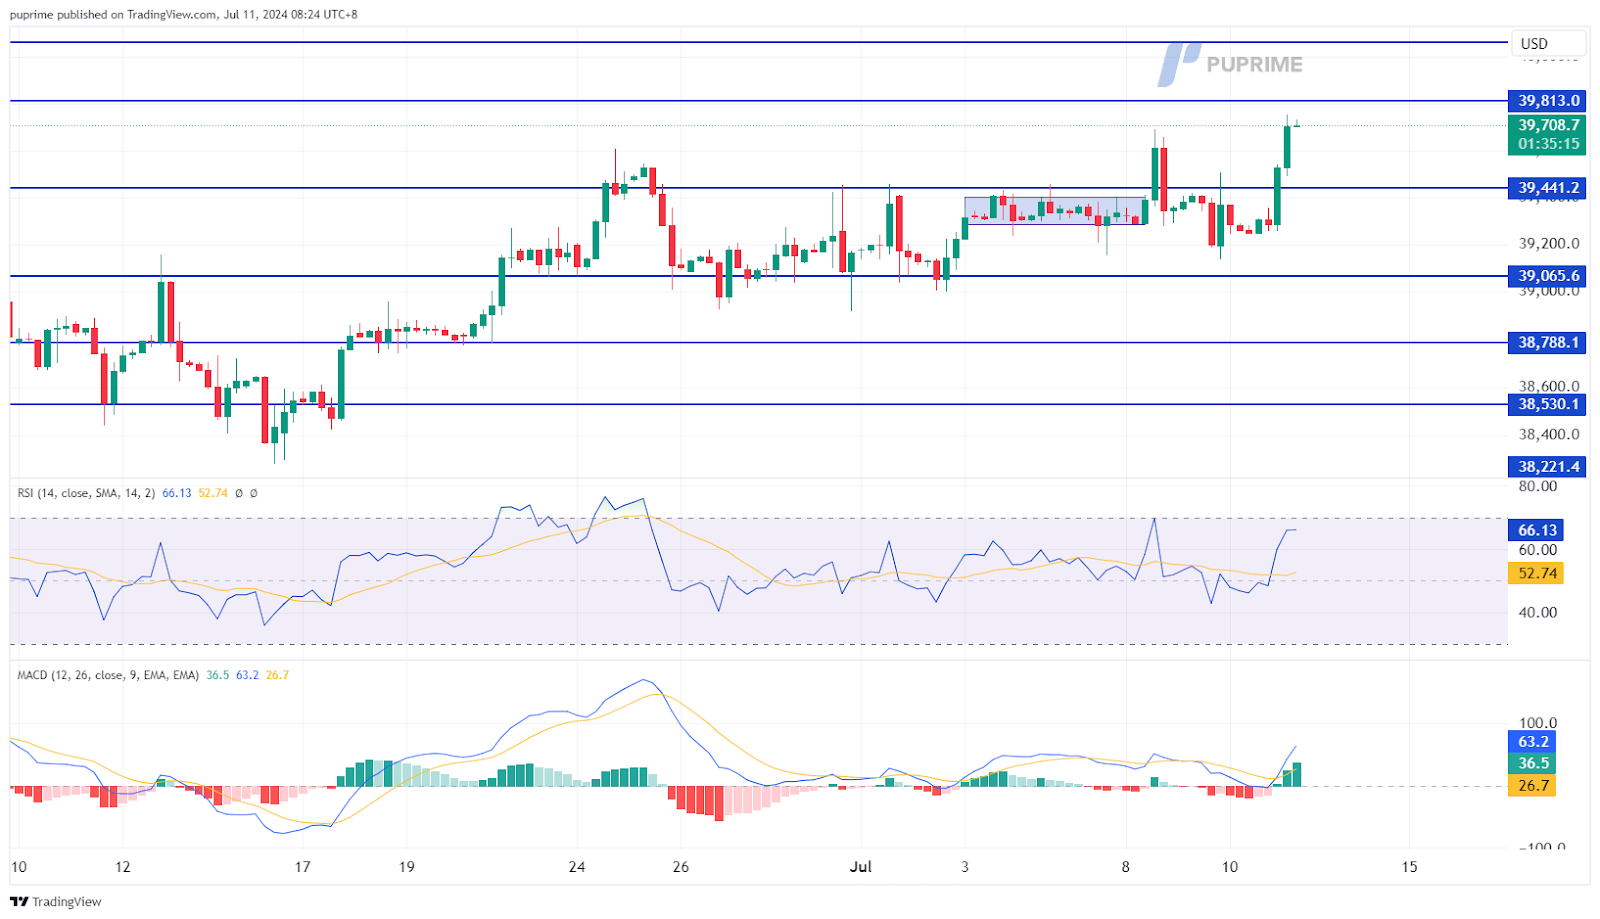
Wall Street has geared up as it approaches the earnings report season, with the Dow leading the charts, rising more than 1% in the last session. The risk-on sentiment in the market heightened as Jerome Powell wrapped up his 2-day testimony, with a dovish perception prevailing. This dovish speculation on the Fed is favouring the equity market, bolstered by optimism regarding the earnings performance of the megacaps.
The Dow has risen to its highest level in 2-months suggesting a bullish bias for the index. The RSI is rising toward the overbought zone while the MACD has a sharp rebound from the zero line, suggesting the buying power is picking up.
Resistance level: 39800.00, 40070.00
Support level: 39450.00, 39065.00
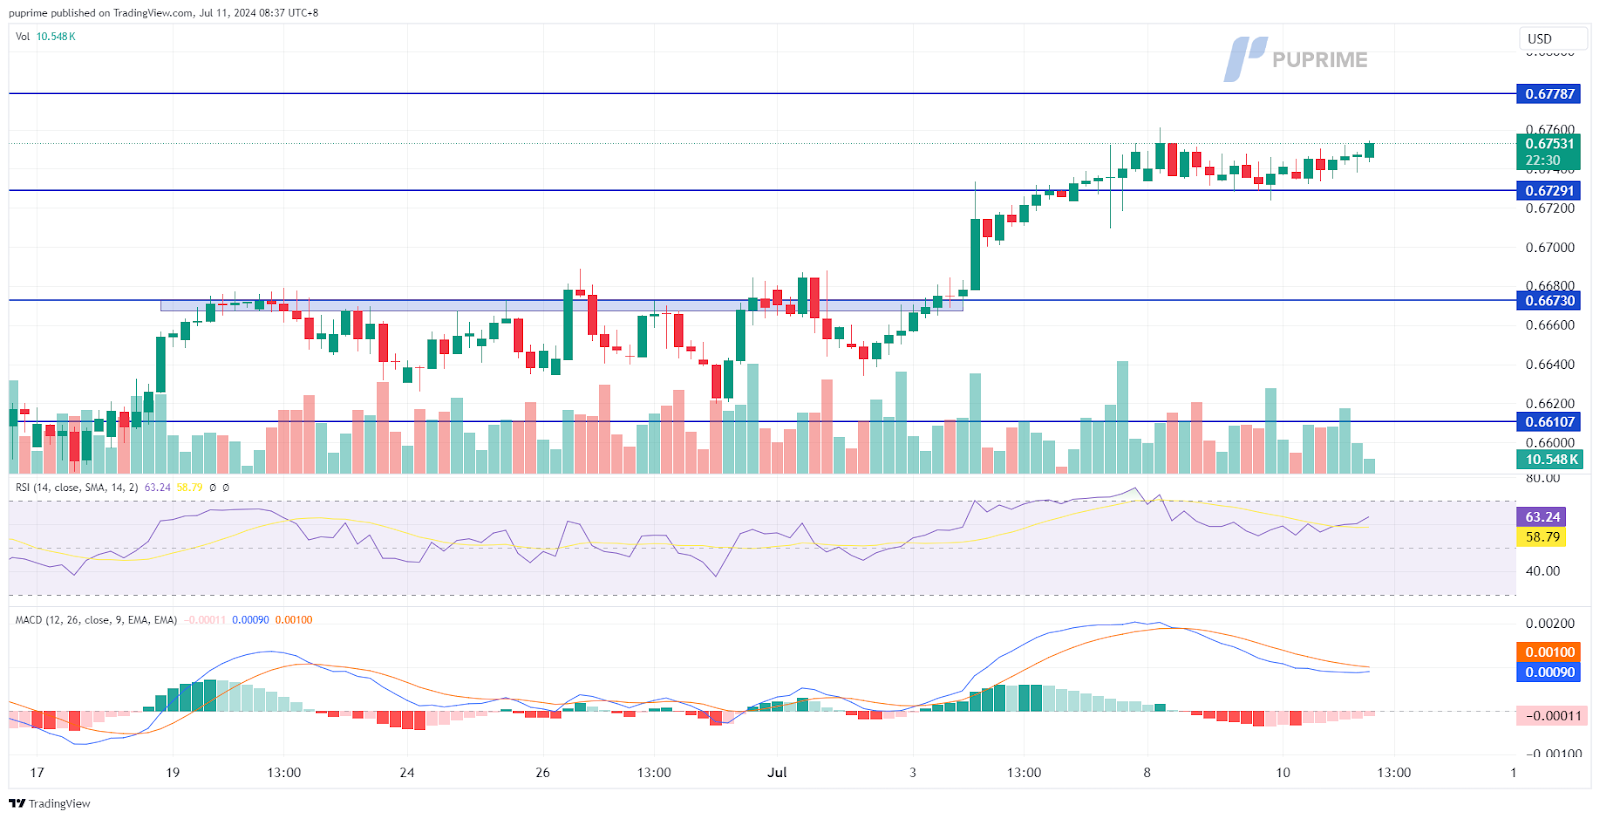
The Australian Dollar was able to shrug off the downbeat Chinese CPI reading, as poor economic performance typically weighs on the Chinese proxy currency, the Aussie Dollar. However, Australia’s inflation rate remains one of the highest among its peers, suggesting the RBA may consider raising rates further to curb persistent inflation. Meanwhile, today’s U.S. CPI release could also be a pivotal point for the pair, influencing its direction based on the strength or weakness of the U.S. Dollar.
The AUD/USD is on the brink of breaking above its price consolidation range. A break above suggests a bullish signal for the pair. The RSI has been hovering closely above the overbought zone, while the MACD has signs of rebounding, suggesting that the bullish momentum remains strong.
Resistance level: 0.6780, 0.6850
Support level: 0.6730, 0.6670
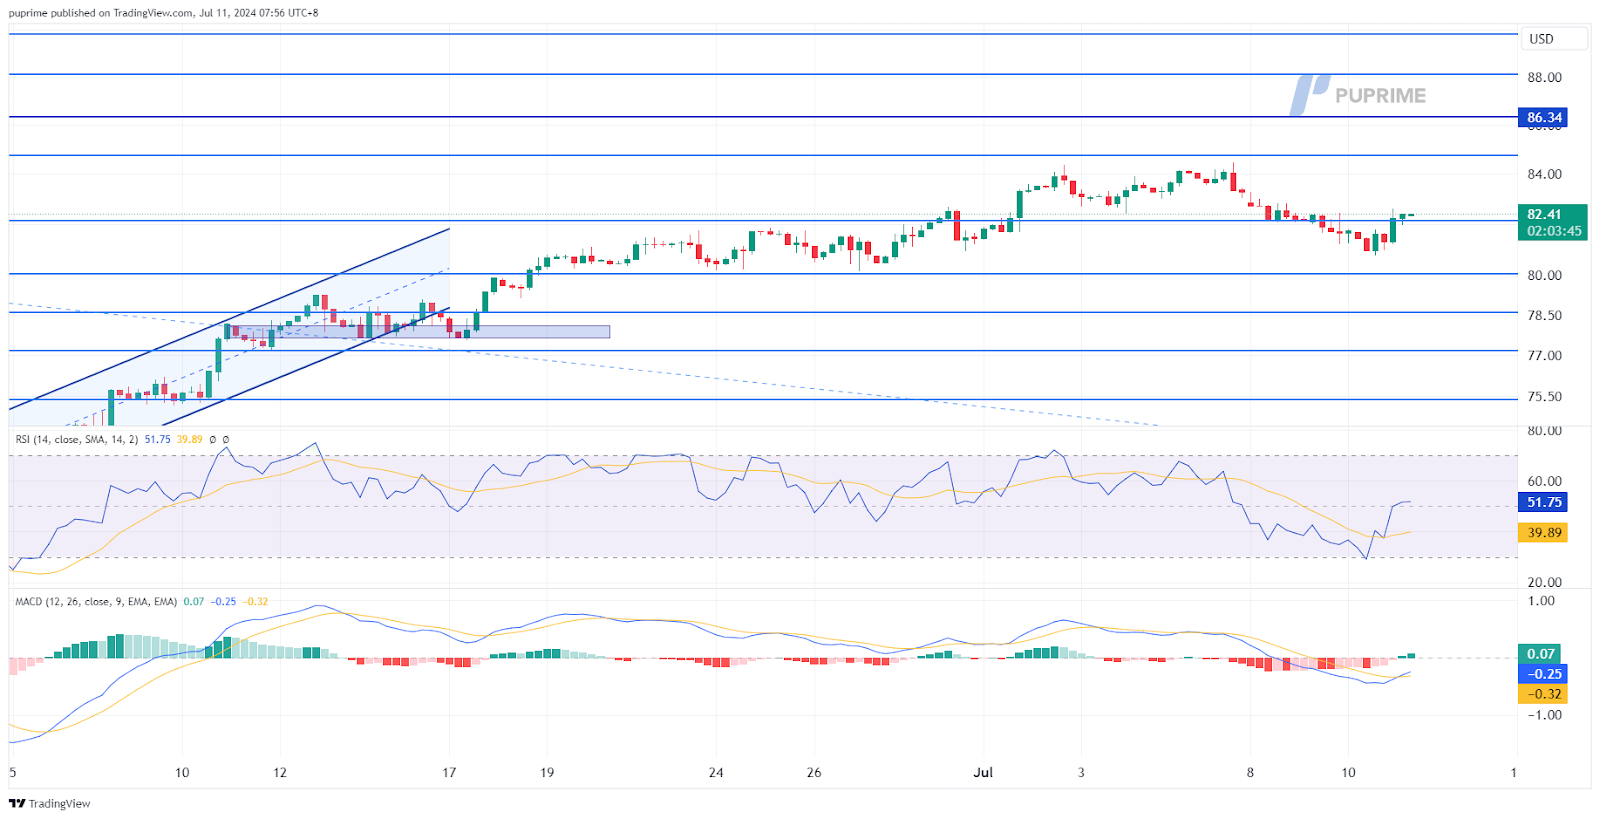
Oil prices slipped below their key support level at $82.15 but managed to erase all losses later in the session. The release of the OPEC monthly report boosted optimism, as the oil cartel forecasted increased demand in the second half of 2024. They suggested that resilient economic growth and the summer holiday period would boost fuel demand and support oil prices.
Oil prices can rebound from the Fibonacci retracement of 23.6%, suggesting the oil price remains trading in its bullish trajectory. The RSI has rebounded while the MACD has crossed below the zero line, indicating bearish momentum is vanishing.
Resistance level: 84.00, 86.35
Support level: 81.40, 79.70

Trade with simulated capital and earn real profits after you pass our trader assessment.

20 May 2025, 06:46 Gold Slips as Ceasefire Hopes Curb Safe-Haven Demand

7 May 2025, 03:59 Geopolitical Risks and FOMC Uncertainty Shake Global Markets

6 May 2025, 05:53 Dollar Dips, Gold Rallies on U.S.-Taiwan Risk


New Registrations Unavailable
We’re not accepting new registrations at the moment.
While new sign ups are unavailable, existing users can continue their challenges and trading activities as usual.
Disclaimer: This website exclusively provides proprietary trading services. We do not engage in any regulated activities, offer investment management services, or manage funds on behalf of external clients. Our trading activities are conducted solely with the firm's own capital, and we do not accept client deposits or manage client accounts. It's important to note that none of the services we provide should be construed as investment or financial services in accordance with applicable laws.
This website offers services related to professional skill and experience assessment, which determine your eligibility to trade with the firm's capital. The outcome of these services is inherently determined by your individual skill level and ability to perform within the trading requirements and objectives outlined for each service separately. Clients are strongly advised to thoroughly understand the requirements of the services before signing up for any.
The content provided on this website is for informational purposes only and does not constitute financial, investment, or trading advice. The information presented is based on sources believed to be reliable, but we do not guarantee its accuracy, completeness, or timeliness. We disclaim any liability for any loss or damage arising directly or indirectly from the use of or reliance on the information provided on this website.
This website is not directed to residents of certain jurisdictions such as the United States, Singapore, Australia, China and some other specified regions, and is not intended for distribution to, or use by, any person in any countries or jurisdictions where such distribution or use would be contrary to local law or regulation.
This website is owned by Finzero Cap Ltd, a company incorporated in the Republic of Cyprus under registration number HE414308, with its registered office at 62 Athalassas, Mezzanine, Strovolos 2012, Nicosia, Cyprus. Finzero Cap Ltd serves as the authorized representative for PU Prime Ltd.
