Join the PU Xtrader Challenge Today
Trade with simulated capital and earn real profits after you pass our trader assessment.
Join the PU Xtrader Challenge Today
Trade with simulated capital and earn real profits after you pass our trader assessment.
5 August 2024,05:38
Daily Market Analysis
5 August 2024, 05:38
*The strengthening of the Japanese Yen shattered the financial market.
*The commodity market weighs on the deteriorating economic outlook.
*BTC dropped below $55000 as the risk appetite in the crypto market was affected by the Macro uncertainty.
The aftermath of the Japanese yen’s strengthening has manifested in significant dips across multiple markets, including equities, commodities, and various currencies. The yen has erased all its 2024 losses against the dollar, moving towards the 145.00 mark. The dollar index (DXY) has fallen to its lowest level since March, hovering above the $103 mark. Asian stock markets have plummeted at the start of the week, with the Nikkei leading the decline, dropping over 5% in Monday’s Tokyo session.
The risk-off sentiment has failed to support safe-haven assets, with gold seesawing at its recent high level. Oil has slid to its 2-month low, weighed down by a deteriorating economic outlook. In the crypto market, Bitcoin tumbled below the $55,000 mark, marking the largest single-day drop since the collapse of FTX. The liquidity crunch, combined with heightened risk-off sentiment, has also negatively impacted the crypto market.
Current rate hike bets on 18th September Fed interest rate decision:
Source: CME Fedwatch Tool
0 bps (88.5%) VS -25 bps (11.5%)
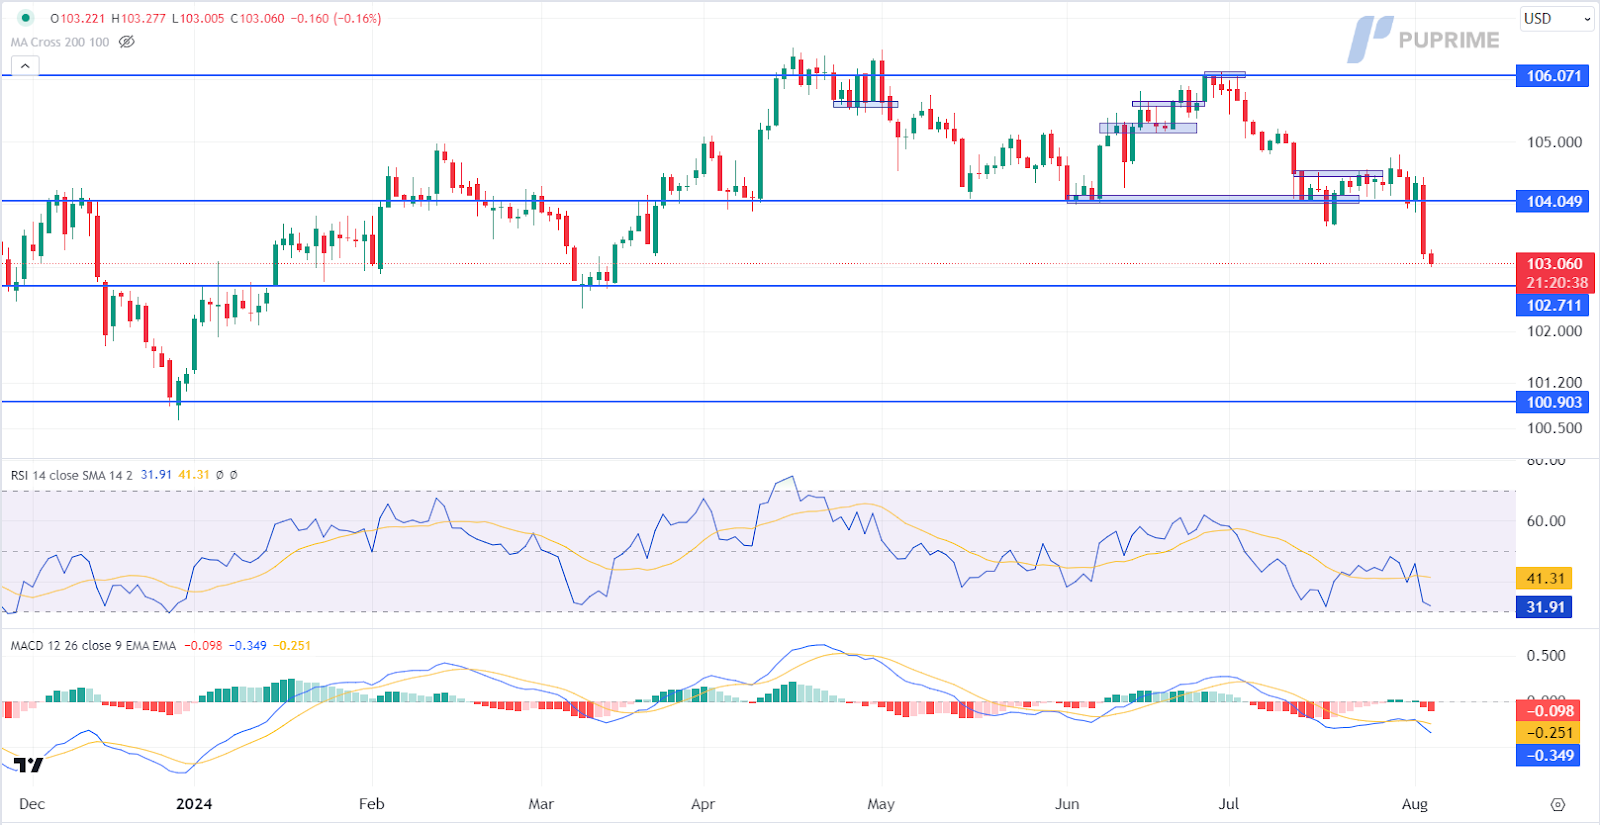
The Dollar Index, which trades against a basket of six major currencies, extended its losses after weaker-than-expected employment reports for July raised expectations that the Federal Reserve will cut interest rates aggressively in September. According to the US Labor Department, US Nonfarm Payrolls dropped significantly from the previous 179K to 114K, far below market expectations of 176K. Additionally, the US Unemployment Rate increased sharply to 4.30%, worse than the market expectations of 4.10%. Market participants are now pricing in a 71% probability that the Fed will cut rates by 50 basis points in September, up from 31% before the data was released, according to the CME FedWatch Tool.
The Dollar Index is trading lower following the prior breakout below the previous support level. MACD has illustrated increasing bearish momentum, while RSI is at 32, suggesting the index might extend its losses since the RSI stays below the midline.
Resistance level: 104.05, 106.05
Support level: 102.70, 100.90
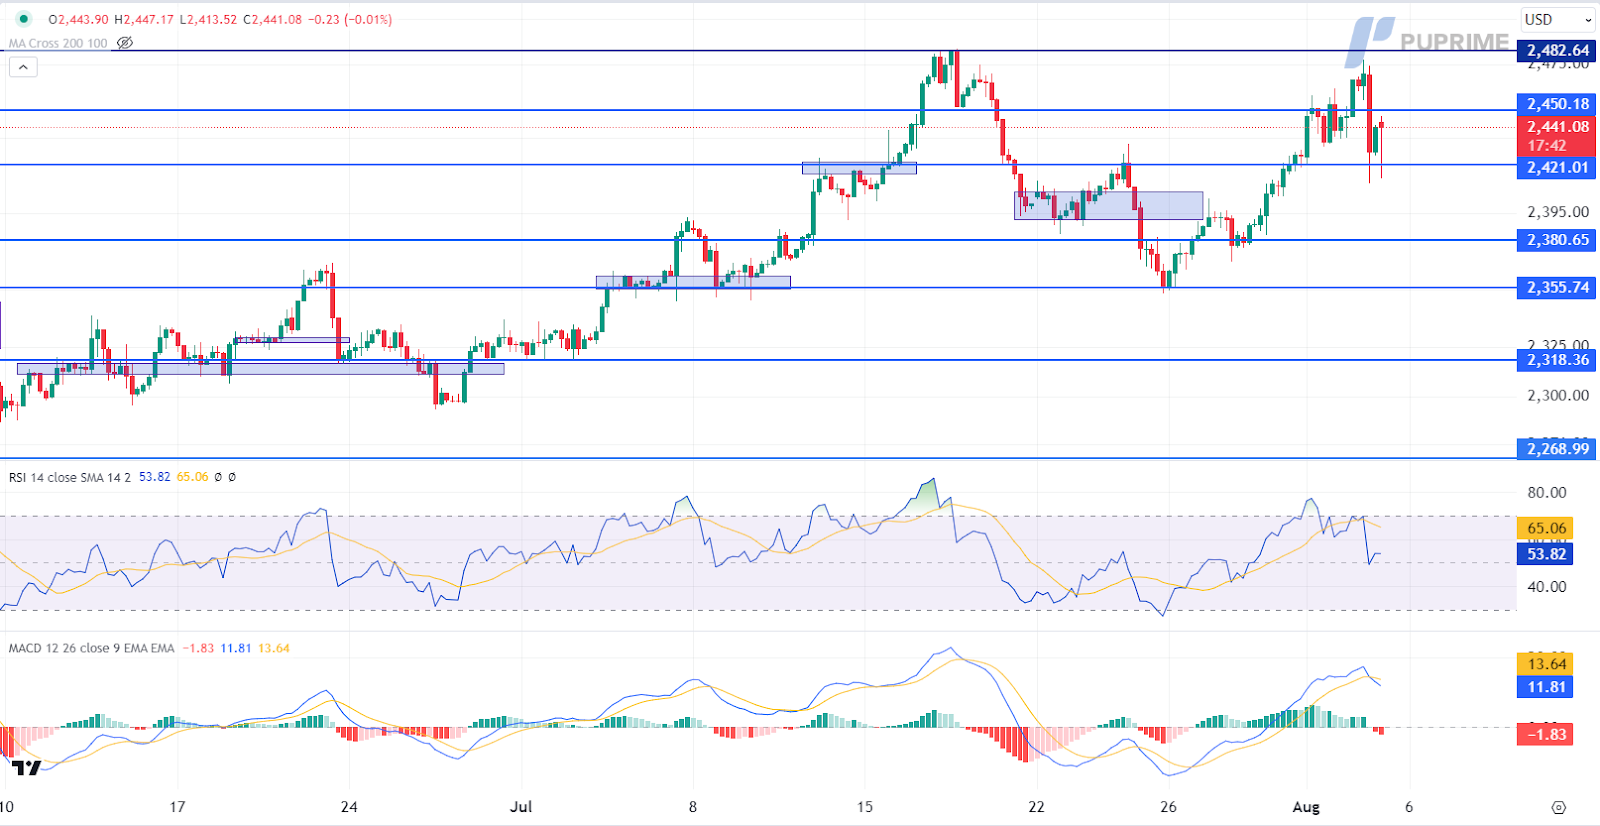
Gold prices tumbled after hitting a two-week high as market participants took profits and prepared for significant movement in an eventful and volatile week. After the downbeat US jobs report was released, gold prices initially rebounded sharply due to expectations that the Fed might consider cutting interest rates and the subsequent depreciation of the Greenback. However, global market volatilities rose significantly, causing several crucial asset classes, including cryptocurrencies, stocks, and oil, to tumble. This led some institutional investors to sell off gold to raise cash and prevent aggressive margin calls from banks.
Gold prices are consolidating in a range while currently testing the resistance level. However, MACD has illustrated diminishing bullish momentum, while RSI is at 64, suggesting the commodity might enter overbought territory.
Resistance level: 2450.00, 2485.00
Support level: 2420.00, 2380.00
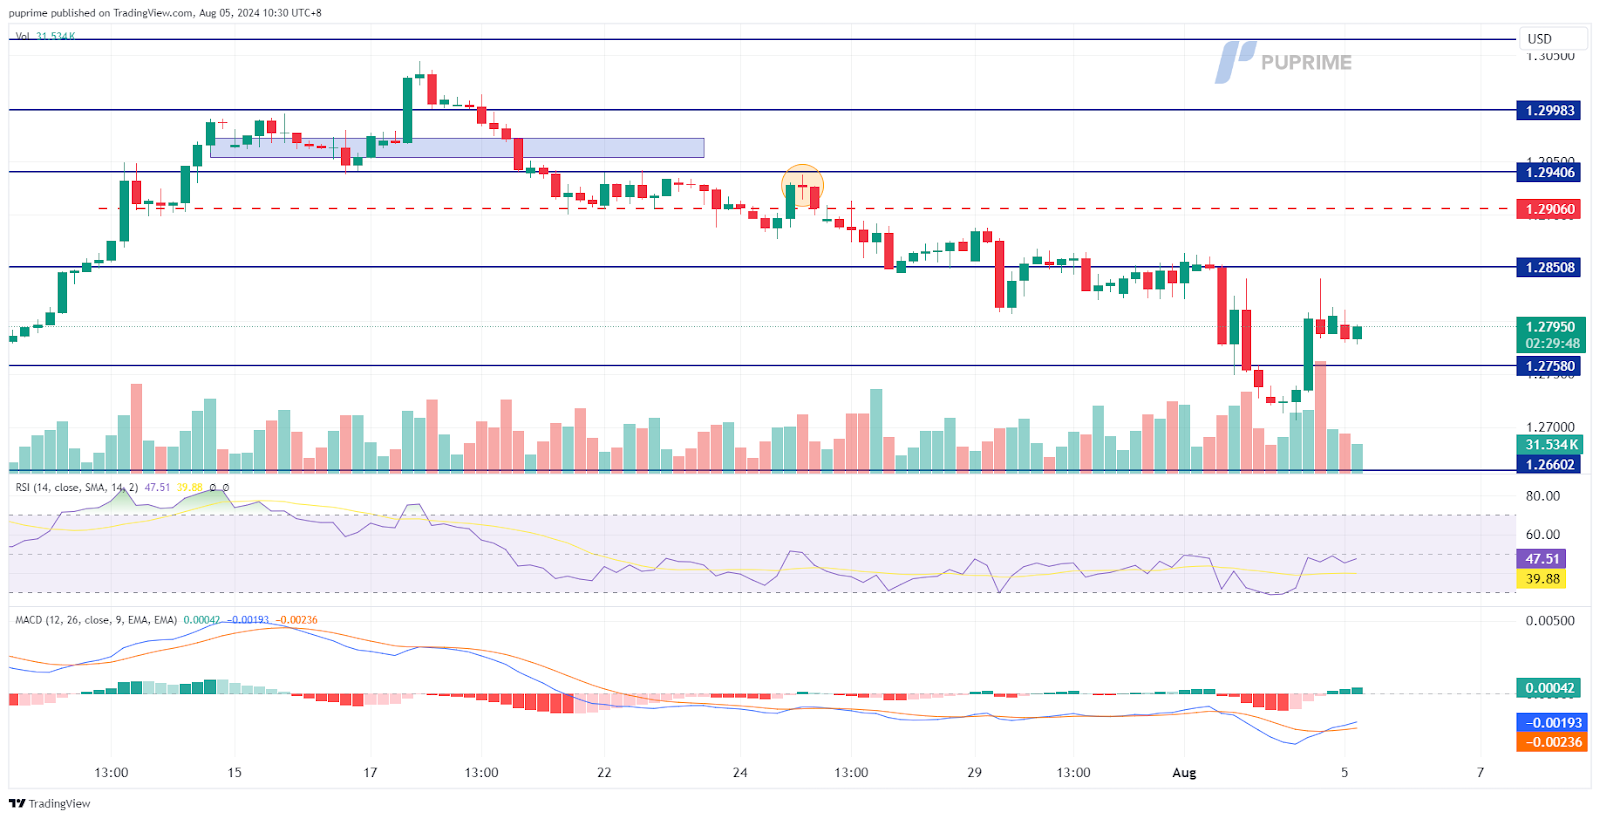
Pound Sterling has weakened following the first Bank of England (BoE) rate cut in the post-pandemic period. However, the U.S. dollar has also faced pressure, submerging after last Friday’s Non-Farm Payroll (NFP) reading, which came in significantly lower than market expectations. This has heightened the likelihood of a September rate cut by the Federal Reserve, leading to significant selling pressure on the dollar, which is now trailing towards the $103 mark.
GBP/USD has recorded a technical rebound from its one-month low but remains trading on its downtrend trajectory. The RSI remains below the 50 level, while the MACD has a bullish cross below the zero line, suggesting the bearish momentum is easing.
Resistance level: 1.2855, 1.2940
Support level: 1.2760, 1.2705
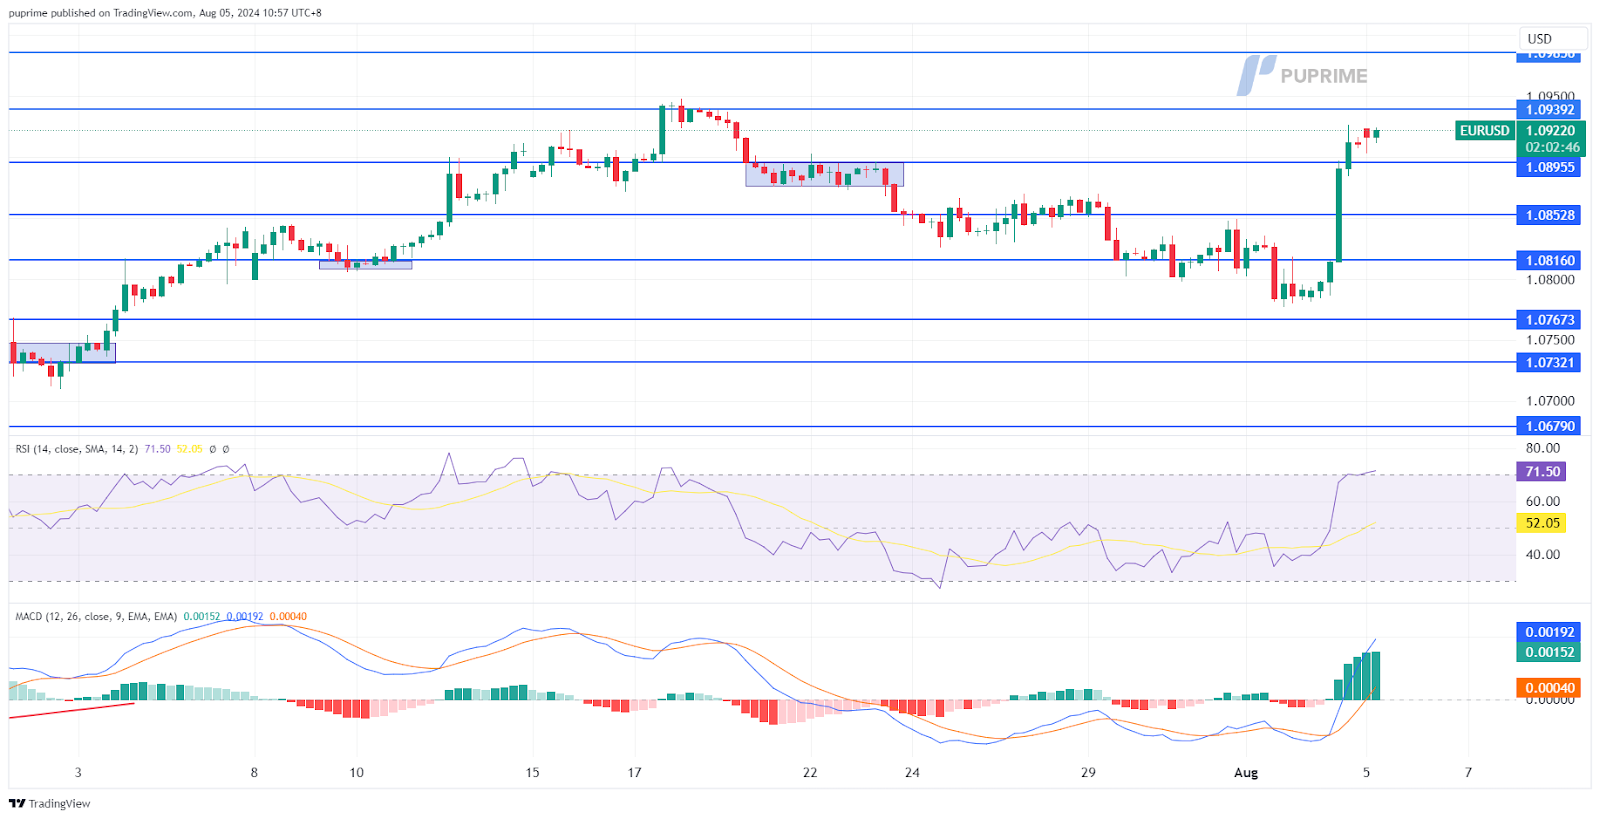
The EUR/USD surged sharply by more than 1% in the last session as the euro capitalised on the softened U.S. dollar, erasing all its previous losses. The soft NFP reading released last Friday, in contrast with the upbeat eurozone CPI reading suggesting persistent inflation in the region, has pushed the pair to trade at recent high levels.
The EUR/USD pair showed a strong trend reversal signal and rebounded sharply from its recent low level to its recent high level. The RSI is breaking into the overbought zone, while the MACD has broken above the zero line and is diverging, suggesting strong bullish momentum.
Resistance level: 1.0940, 1.0985
Support level: 1.0895, 1.0850
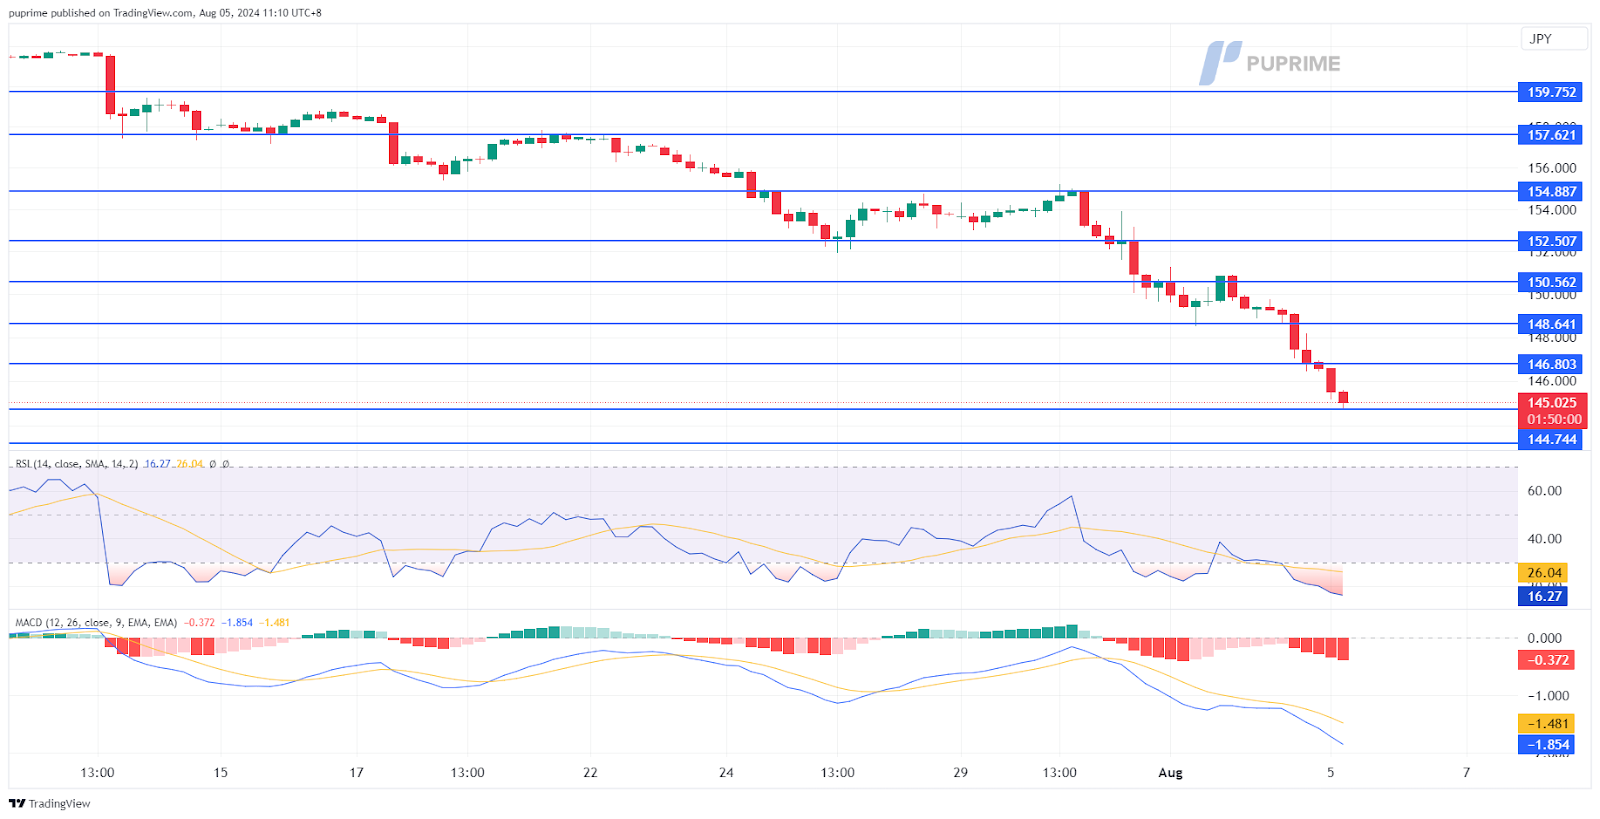
The USD/JPY pair has traded to its lowest level in 2024, erasing all its gains for the entire year. The potential narrowing of the interest rate gap between the two currencies has led to the sharp decline of the pair. The Japanese yen strengthened following a 15 bps rate hike last week, and the market is anticipating another 25 bps rate hike by the end of this year. In contrast, the dollar was hammered down by the soft NFP reading released last Friday, suggesting the Fed is close to having its first rate cut in the post-pandemic era.
The pair is currently trading with extreme bearish momentum and is about to break its lowest level in 2024. The RSI has gotten into the oversold zone, while the MACD is edging lower at below the zero line, suggesting that the bearish momentum remains strong.
Resistance level: 146.80, 148.65
Support level: 143.20, 141.35
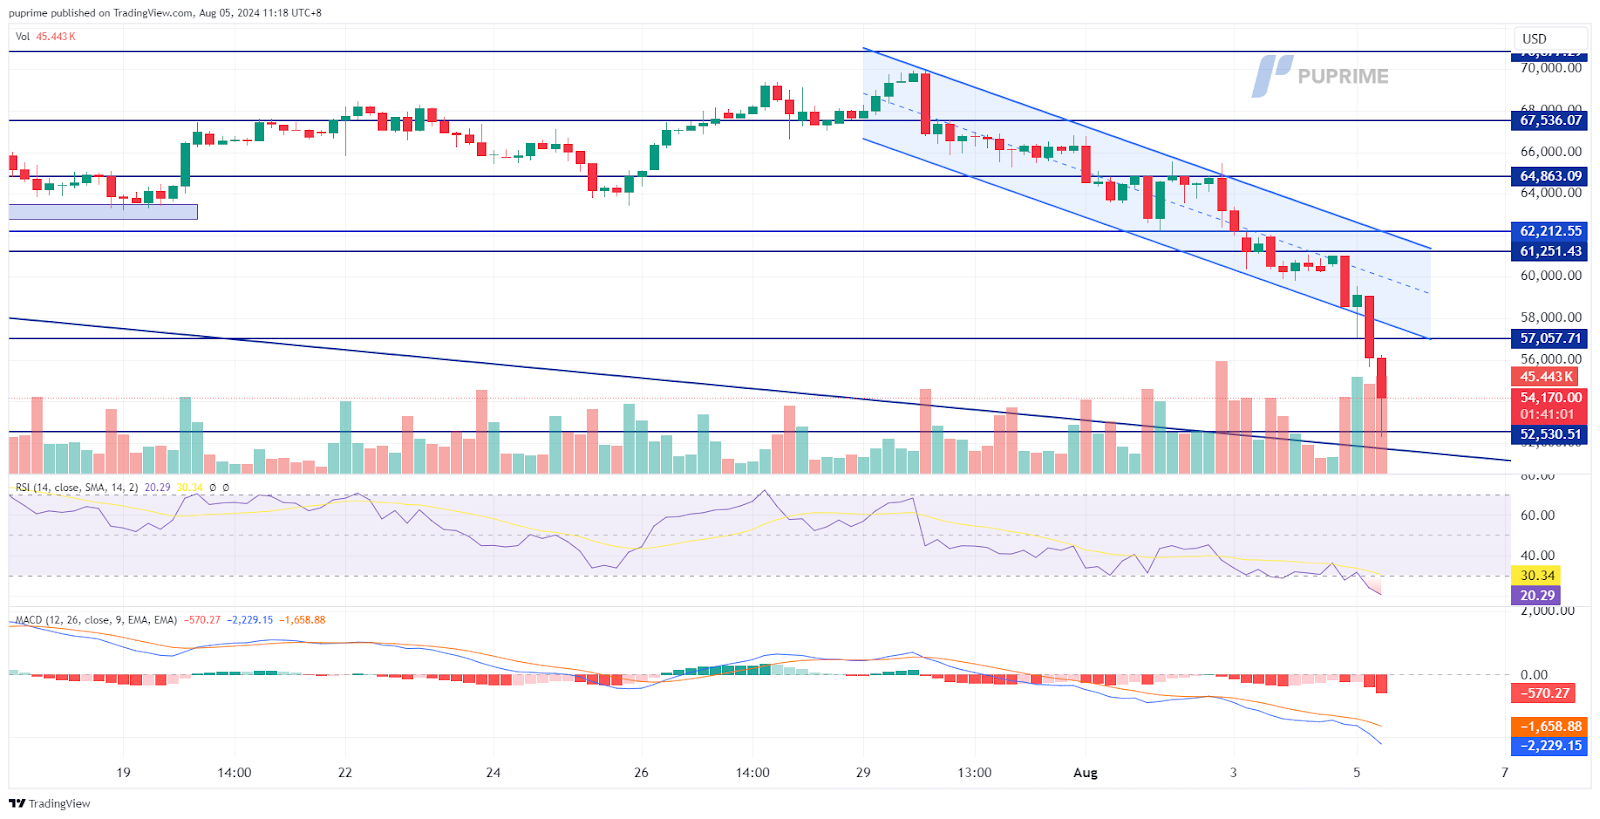
BTC has dropped below its downtrend channel, suggesting a bearish signal for the cryptocurrency. Macroeconomic uncertainty over the deteriorating economic outlook, as well as geopolitical uncertainty arising from heightened Middle East tensions, have affected risk appetite in the crypto market. This has led to massive selling pressure on BTC.
The BTC is currently trading on its strong bearish trend, having dropped below its downtrend channel. The RSI has gotten into the oversold zone, while the MACD is edging lower and diverging, suggesting that the bearish momentum is gaining.
Resistance level: 57060.00, 61250.00
Support level: 52530.00, 48000.00
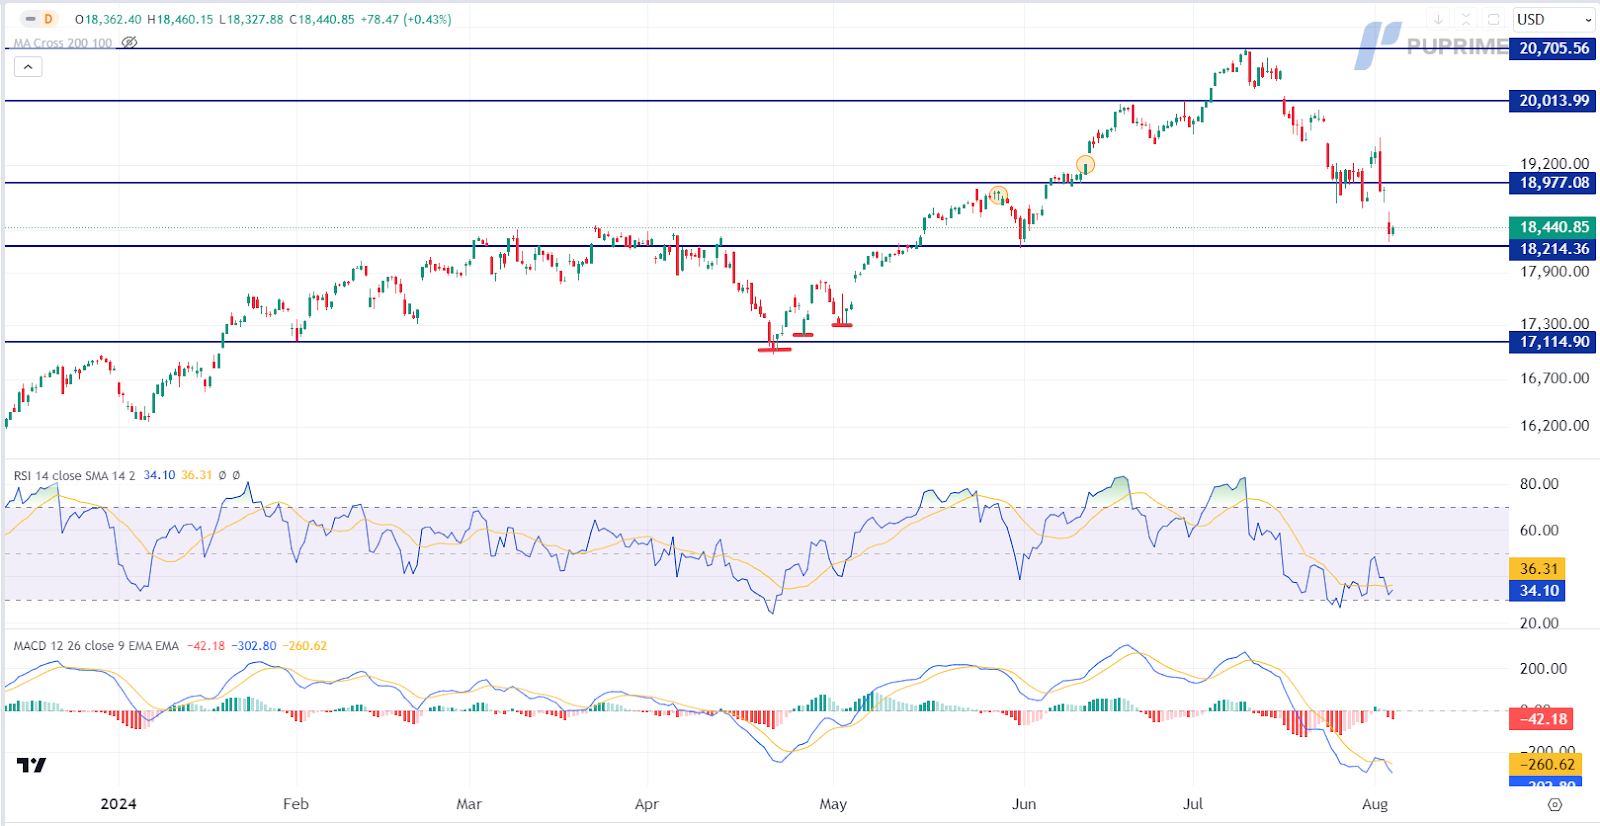
The US equity market tumbled as persistent concerns over an economic slowdown and extended profit-taking in technology stocks weighed on sentiment. A string of weak readings on business activity and the labor market ramped up concerns that the Federal Reserve’s high interest rates had overstayed their welcome, diminishing hopes for a soft landing for the economy. Selling pressure remained largely focused on technology stocks, with the NASDAQ Composite falling 2.4%, the S&P 500 down by 1.8%, and the Dow Jones Industrial Average falling 1.5%.
Nasdaq is trading lower while currently testing the support level. MACD has illustrated increasing bearish momentum, while RSI is at 34, suggesting the index might extend its losses after breakout since the RSI stays below the midline.
Resistance level: 18975.00, 20015.00
Support level: 18215.00, 17115.00
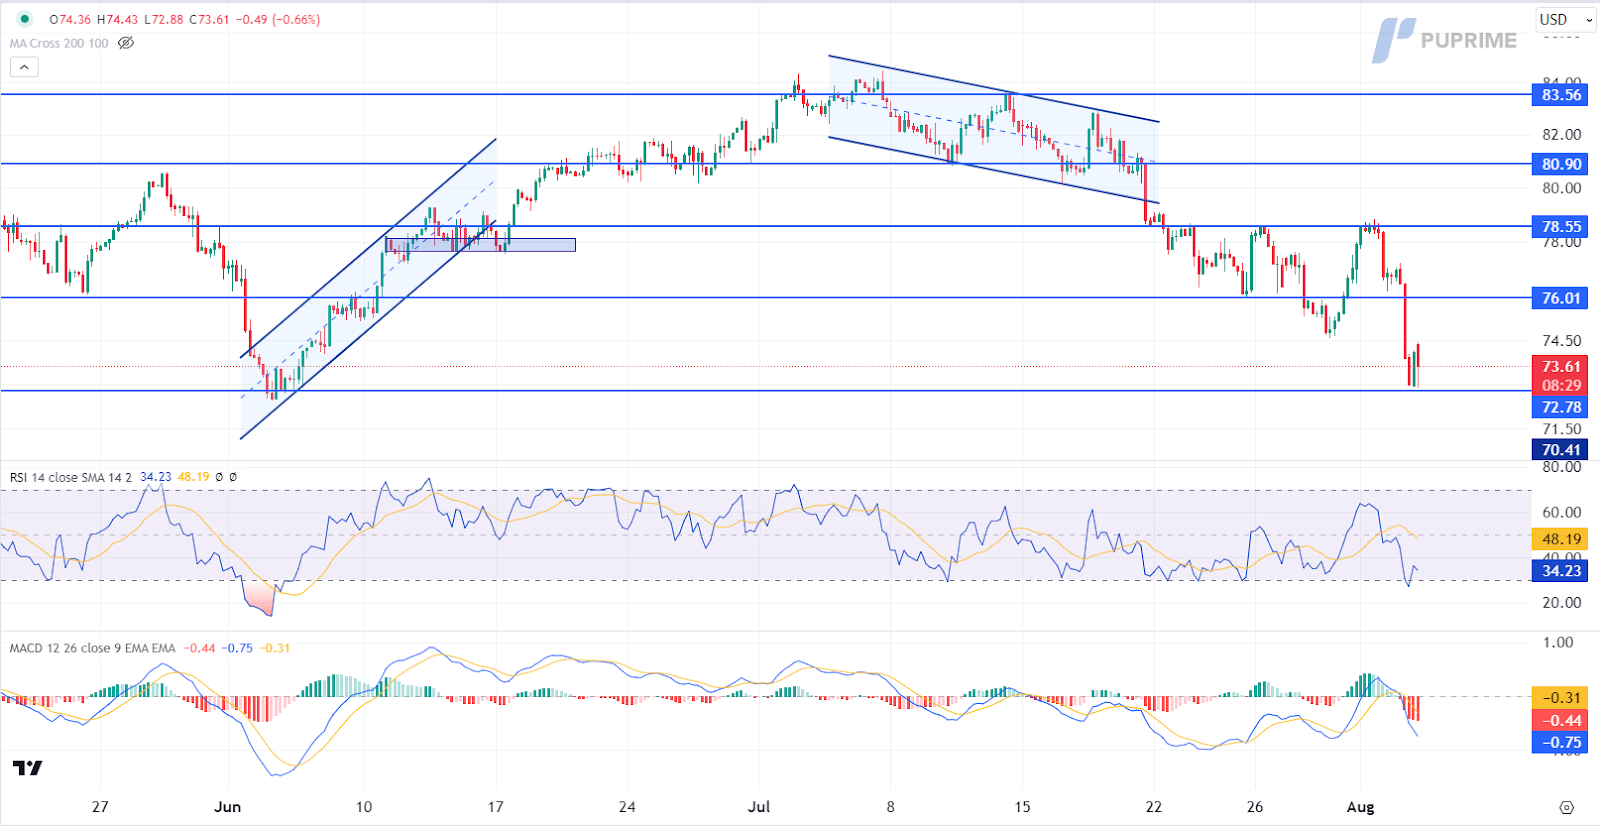
Crude oil prices slumped to eight-month lows as fears of a recession in the United States and China, the world’s two largest oil consumers, continued to weigh on demand prospects. Additionally, the lack of progress in the OPEC+ meeting, with expectations that OPEC+ might delay the phase-out of voluntary production cuts, further pressured oil prices. However, losses were somewhat limited by rising Middle East tensions, which could spark supply disruptions. Investors should keep an eye on potential geopolitical risks and global economic performance for further trading signals.
Oil prices are trading lower while currently testing the support level. MACD has illustrated increasing bearish momentum, while RSI is at 34, suggesting the commodity might extend its losses after breakout since the RSI stays below the midline.
Resistance level: 76.10, 78.55
Support level: 72.80, 70.40

Trade with simulated capital and earn real profits after you pass our trader assessment.

20 May 2025, 06:46 Gold Slips as Ceasefire Hopes Curb Safe-Haven Demand

7 May 2025, 03:59 Geopolitical Risks and FOMC Uncertainty Shake Global Markets

6 May 2025, 05:53 Dollar Dips, Gold Rallies on U.S.-Taiwan Risk


New Registrations Unavailable
We’re not accepting new registrations at the moment.
While new sign ups are unavailable, existing users can continue their challenges and trading activities as usual.
Disclaimer: This website exclusively provides proprietary trading services. We do not engage in any regulated activities, offer investment management services, or manage funds on behalf of external clients. Our trading activities are conducted solely with the firm's own capital, and we do not accept client deposits or manage client accounts. It's important to note that none of the services we provide should be construed as investment or financial services in accordance with applicable laws.
This website offers services related to professional skill and experience assessment, which determine your eligibility to trade with the firm's capital. The outcome of these services is inherently determined by your individual skill level and ability to perform within the trading requirements and objectives outlined for each service separately. Clients are strongly advised to thoroughly understand the requirements of the services before signing up for any.
The content provided on this website is for informational purposes only and does not constitute financial, investment, or trading advice. The information presented is based on sources believed to be reliable, but we do not guarantee its accuracy, completeness, or timeliness. We disclaim any liability for any loss or damage arising directly or indirectly from the use of or reliance on the information provided on this website.
This website is not directed to residents of certain jurisdictions such as the United States, Singapore, Australia, China and some other specified regions, and is not intended for distribution to, or use by, any person in any countries or jurisdictions where such distribution or use would be contrary to local law or regulation.
This website is owned by Finzero Cap Ltd, a company incorporated in the Republic of Cyprus under registration number HE414308, with its registered office at 62 Athalassas, Mezzanine, Strovolos 2012, Nicosia, Cyprus. Finzero Cap Ltd serves as the authorized representative for PU Prime Ltd.
