Join the PU Xtrader Challenge Today
Trade with simulated capital and earn real profits after you pass our trader assessment.
Join the PU Xtrader Challenge Today
Trade with simulated capital and earn real profits after you pass our trader assessment.
5 June 2024,06:18
Daily Market AnalysisMarket Insights
5 June 2024, 06:18
Fundamental Overview
Oil prices experienced their steepest decline of 2024, dropping over 5%, following the release of the American Petroleum Institute (API) weekly crude data, which revealed an unexpected inventory build-up exceeding 4 million barrels. This surprise data, coupled with OPEC+’s decision to increase oil supply in the fourth quarter, exerted significant downward pressure on prices.
In parallel, weaker-than-expected U.S. job data has intensified speculation about a potential Federal Reserve rate cut this year, causing the dollar index to hover near its critical support level at 104.
Today’s market attention will shift to Europe, with the release of PMI readings for both the eurozone and the UK. These figures will provide traders with insights into the strength of the euro and the Pound Sterling. Meanwhile, gold prices have remained range-bound for the past two weeks amid a lack of market catalysts.
Current rate hike bets on 1st May Fed interest rate decision:
Source: CME Fedwatch Tool
0 bps (99.9%) VS -25 bps (0.1%)
Market Movements
DOLLAR_INDX, H4
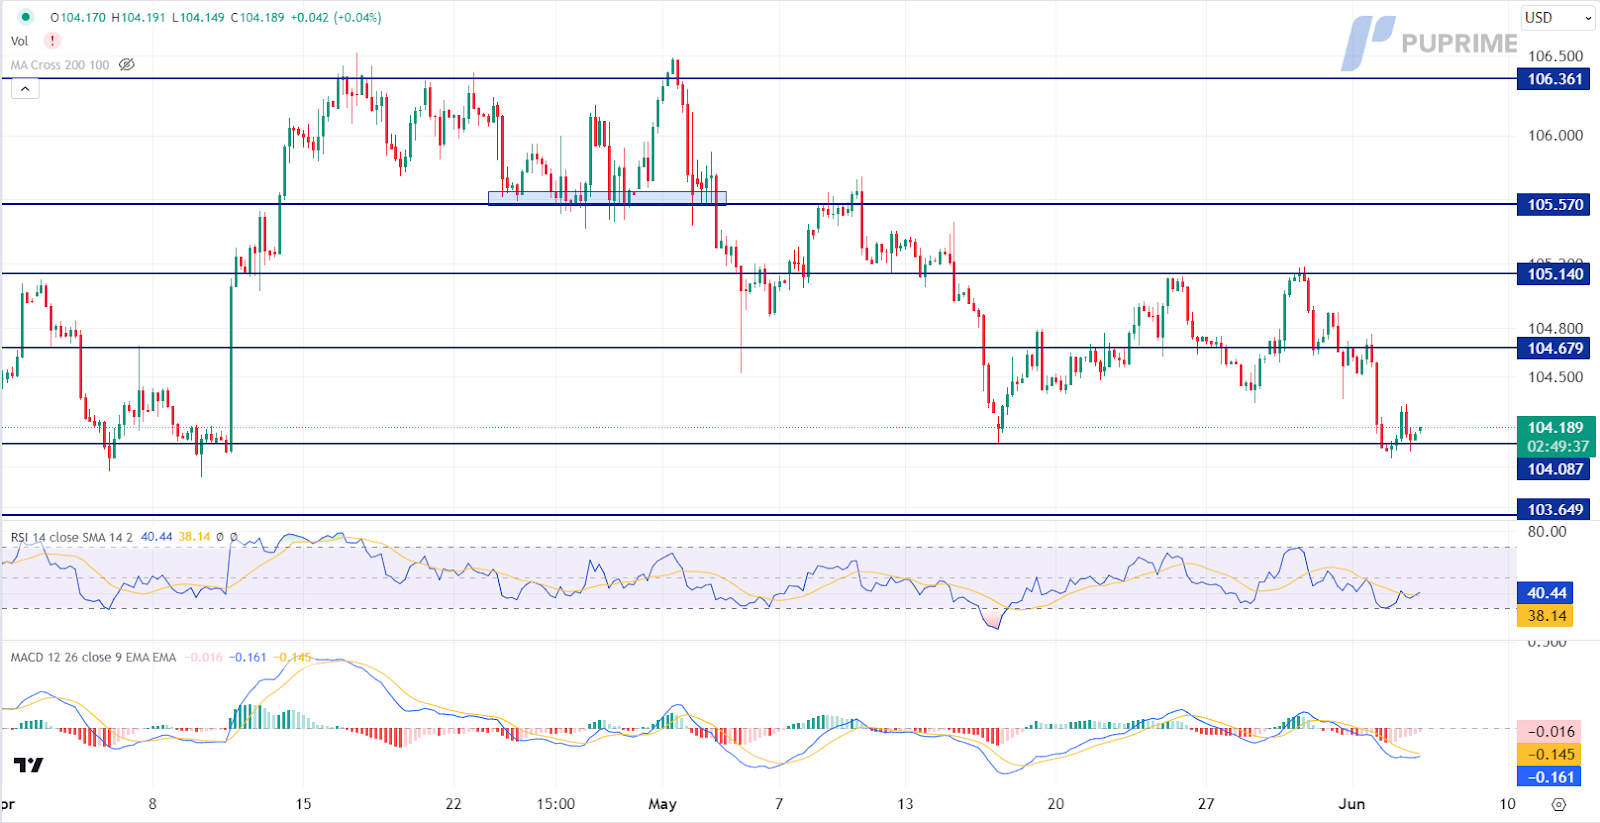
The Dollar Index, which measures the greenback against a basket of six major currencies, steadied as investors eagerly await the forthcoming Nonfarm Payrolls and US Unemployment rate reports for fresh trading signals. The US dollar had previously retreated sharply following a series of disappointing economic data. The slowdown in manufacturing activity, an unexpected decline in construction spending, and a pessimistic JOLTs job openings report, which fell from 8.355 million to 8.059 million against an expected 8.370 million, have heightened uncertainties regarding the US economic outlook.
The Dollar Index is trading lower while currently testing the support level. However, MACD has illustrated diminishing bearish momentum, while RSI is at 40, suggesting the index might experience technical correction since the RSI had entered oversold territory.
Resistance level: 104.70, 105.15
Support level: 104.10, 103.65
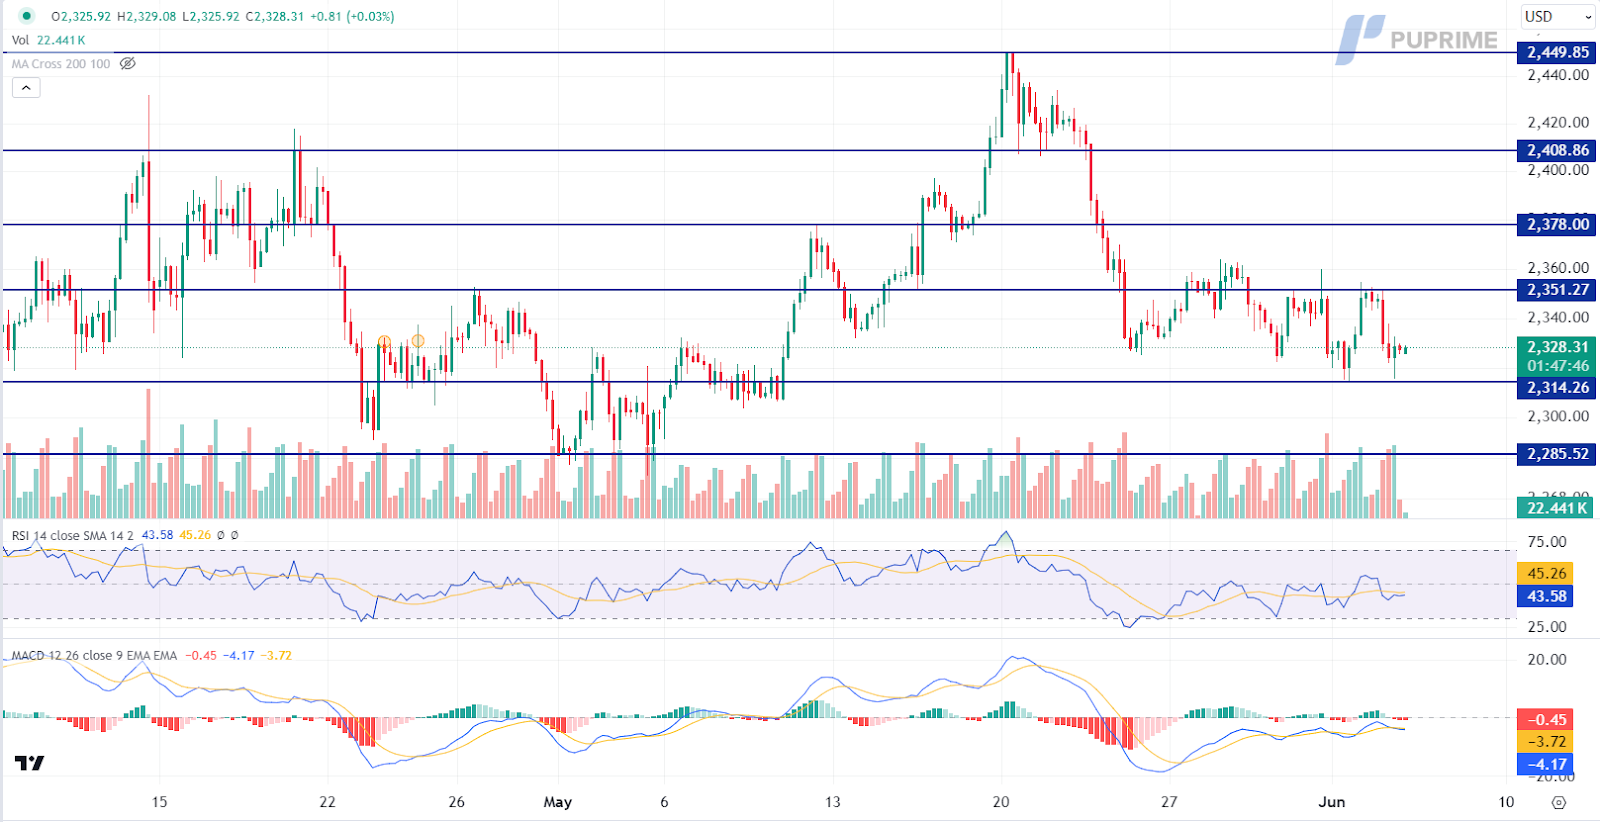
Gold prices saw a slight retreat as traders adopted a consolidation strategy, despite fundamentally strong conditions. The overall outlook for gold remains positive, supported by a string of downbeat US economic data that has fueled a shift towards safe-haven assets. Investors are advised to closely monitor upcoming US jobs reports, including Nonfarm Payrolls and the Unemployment rate, for clearer indications of gold’s future trend.
Gold prices are trading lower while currently near the support level. MACD has illustrated increasing bearish momentum, while RSI is at 43, suggesting the commodity might extend its losses after breakout since the RSI stays below the midline.
Resistance level: 2350.00, 2380.00
Support level: 2315.00, 2285.00
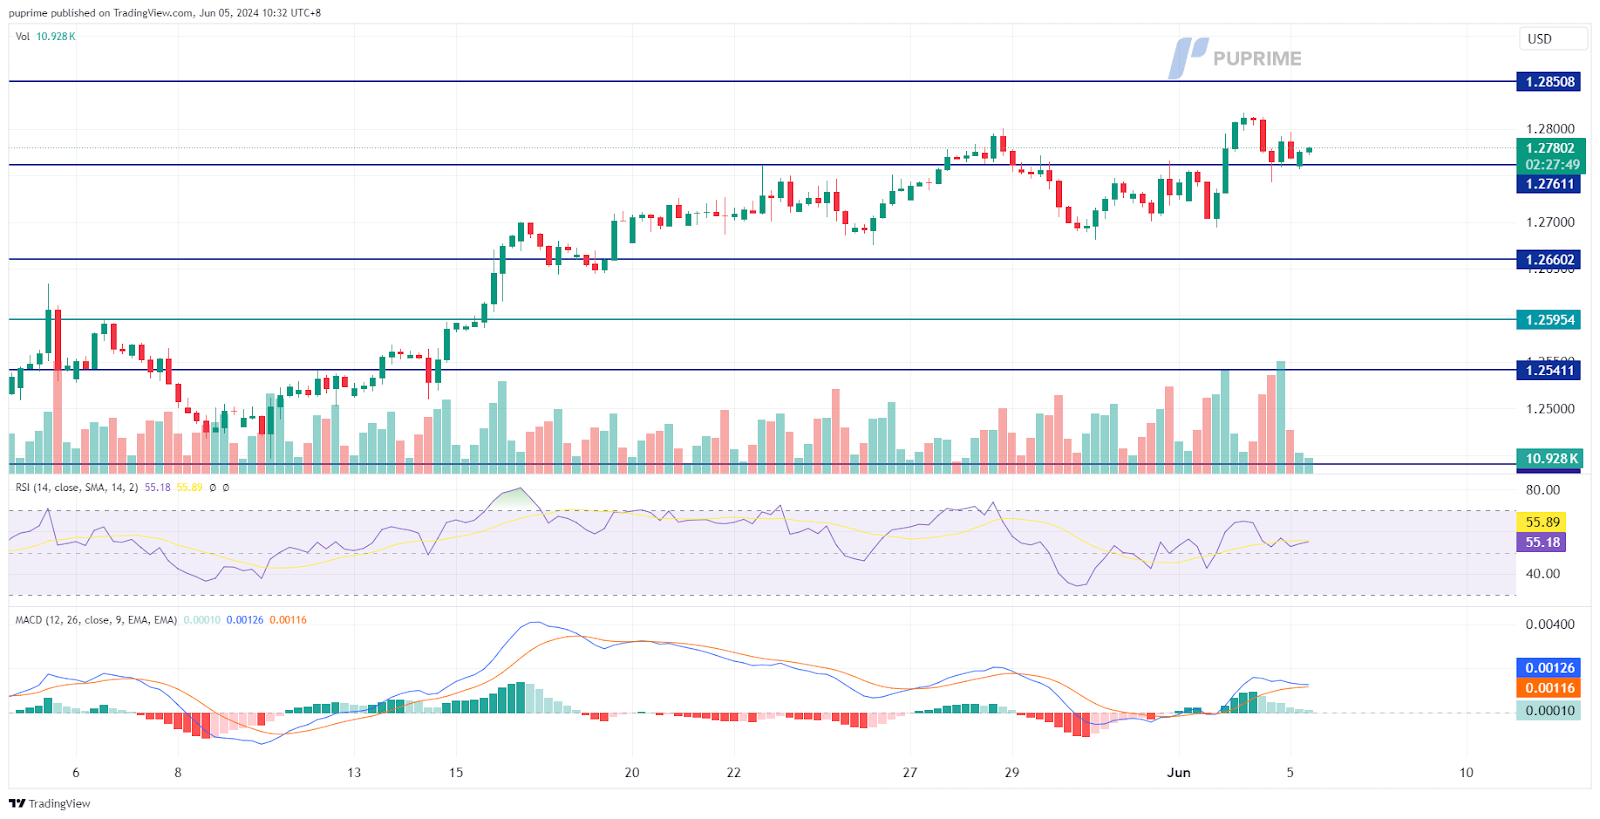
The GBP/USD pair remained range-bound at recent high levels as both the Sterling and the U.S. dollar lacked significant catalysts. Recent U.S. job data fell short of expectations, reinforcing the market perception of a potential Federal Reserve rate cut. Despite this, the dollar held firm at its critical support level of 104. Attention now turns to today’s UK PMI reading, which could influence Sterling’s strength and provide direction for traders.
GBP/USD remains at its elevated levels, but the momentum seems to be easing. The RSI hovers above the 50 level, while the MACD is about to cross above, suggesting that the bullish momentum is easing.
Resistance level: 1.2850, 1.2940
Support level: 1.2760, 1.2660
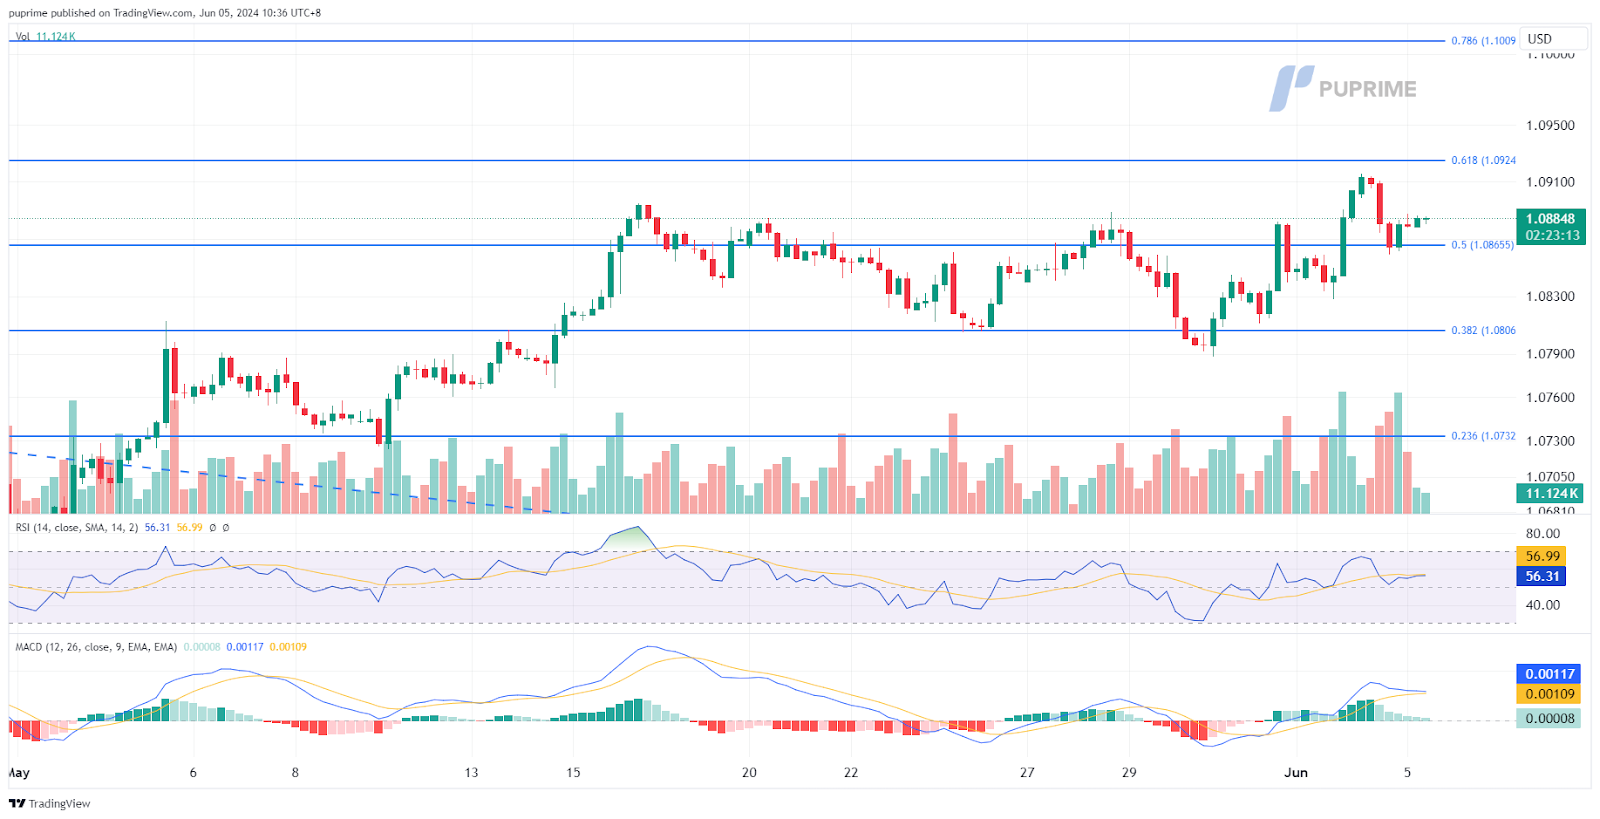
The EUR/USD pair has formed a higher high price pattern, indicating an uptrend trajectory. While disappointing U.S. job data has increased expectations of a Federal Reserve rate cut, speculation about an early rate cut by the European Central Bank (ECB) is also weighing on the euro’s strength. Today’s eurozone PMI readings will be closely watched as traders assess the region’s economic health and its impact on the euro.
The EUR/USD has formed a higher price pattern despite the pair being retraced in the last session. The RSI is gradually moving upward while the MACD has signs to cross on the above suggesting the bullish momentum has turned weak.
Resistance level: 1.0925, 1.1000
Support level: 1.0865, 1.0800
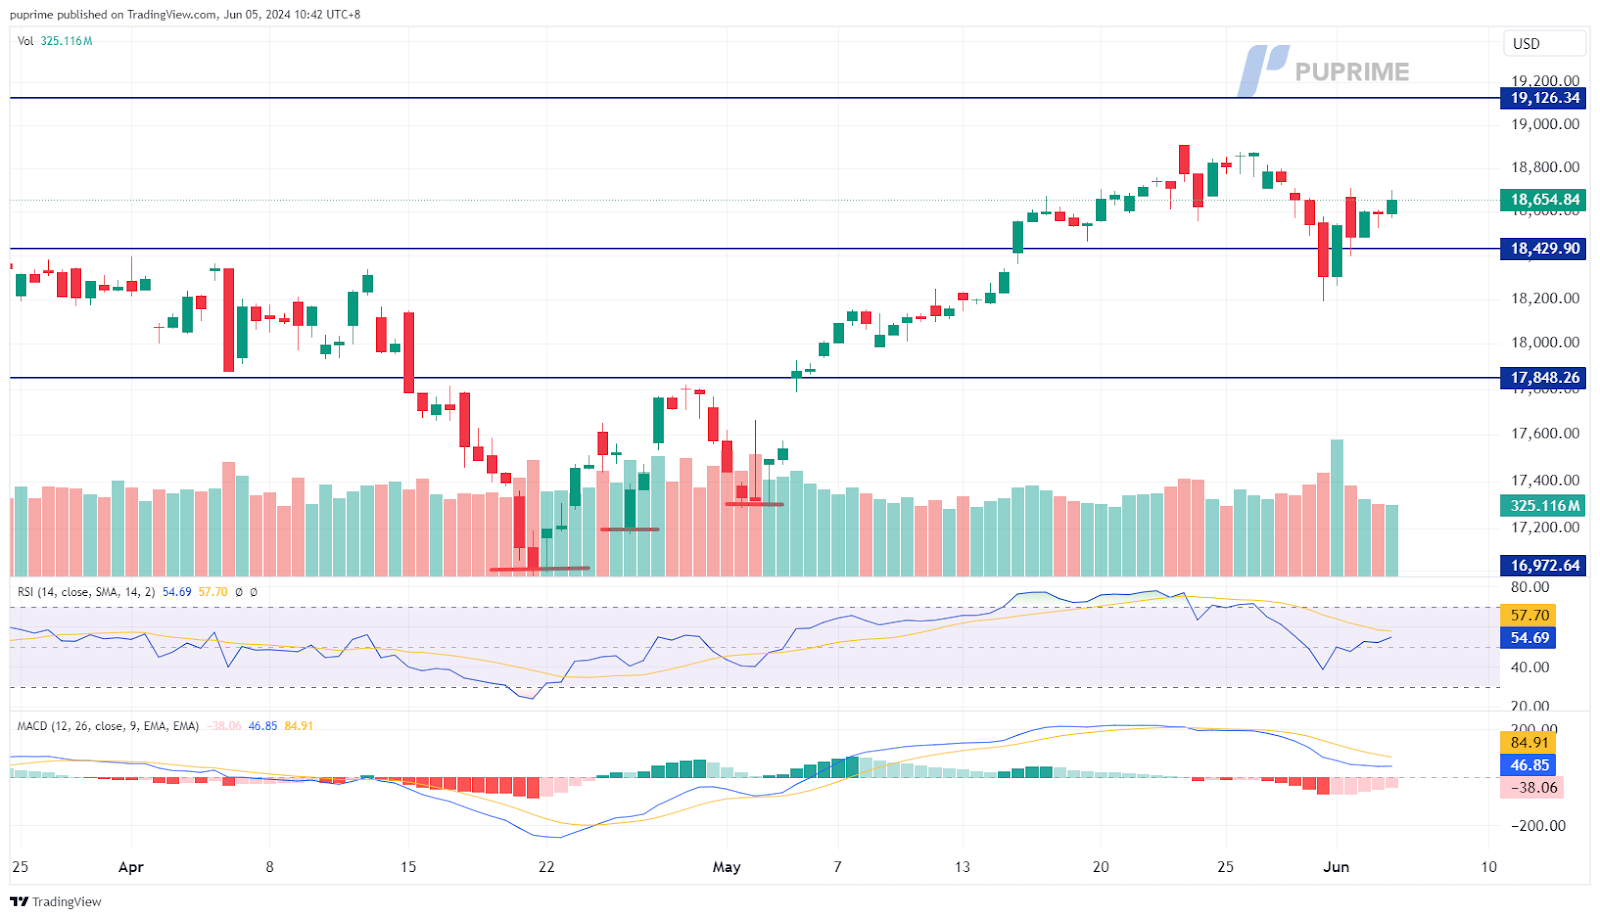
U.S. equity markets were buoyed by downbeat job data and rising expectations of a Federal Reserve rate cut this year, which is favourable for equities. The JOLTs Job Openings data hit its lowest level in years, indicating an easing U.S. labour market and bolstering confidence that inflation may be subsiding. The Nasdaq rebounded at the 38.2% Fibonacci retracement level, suggesting that bullish momentum remains strong.
Nasdaq is able to perform a technical rebound after its experience a technical retracement from it’s all-time high. The RSI rebounded while the MACD showed sign of crossing at above the zero line suggesting a bullish momentum may be forming.
Resistance level: 19125.00, 19690.00
Support level: 18430.00, 17850.00
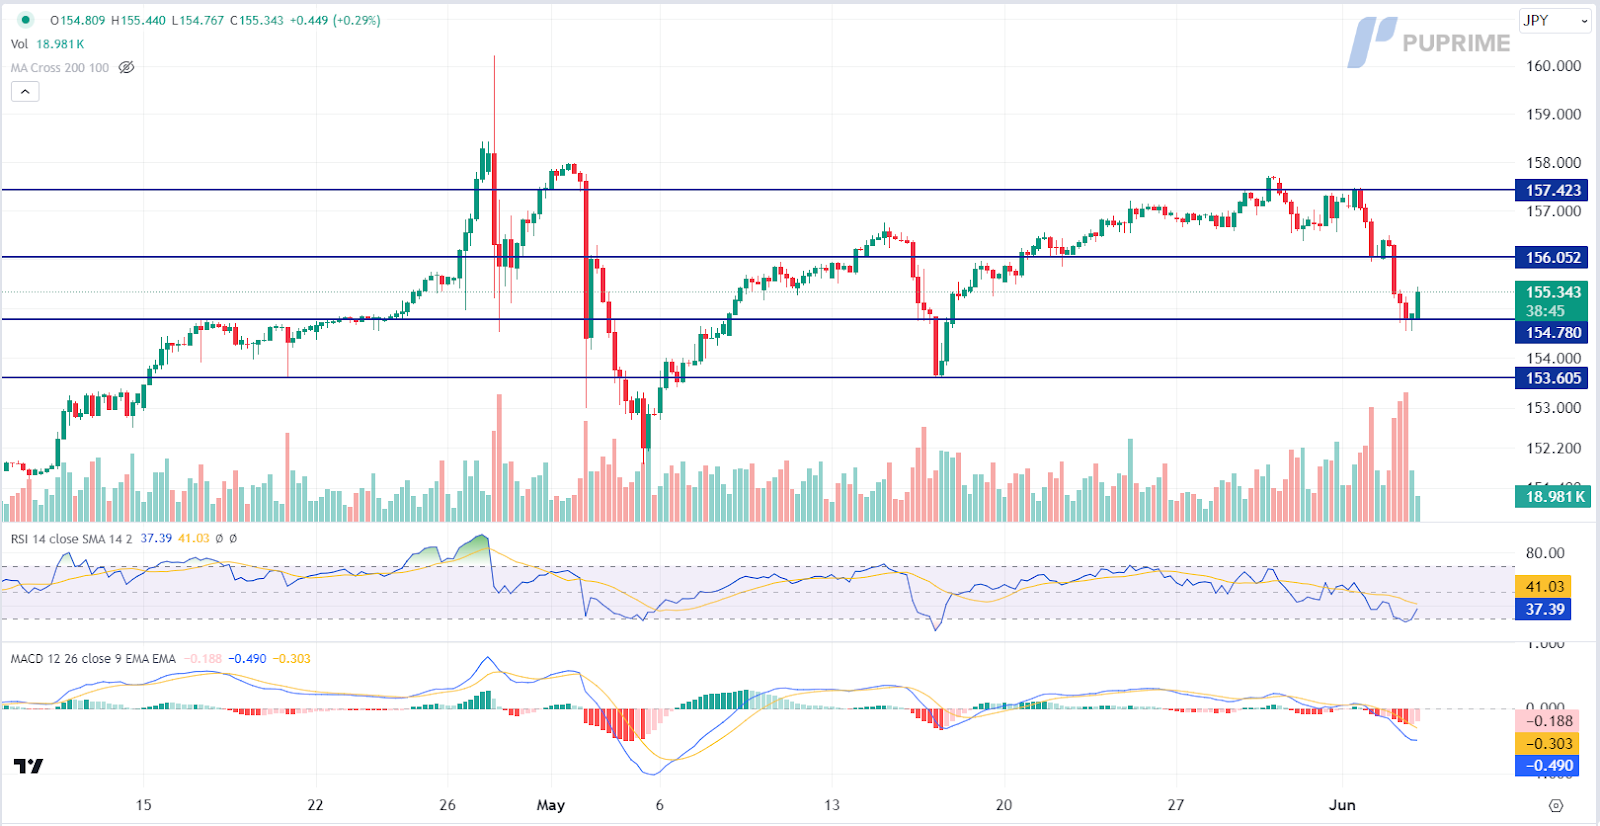
The Japanese yen surged to a two-week high following continuous warning from Japanese authorities about potential currency intervention. While it remains uncertain whether actual intervention will occur, investors should stay vigilant for policy updates to gauge further trading signals. Concurrently, US Treasury yields have dipped, contrasting with Japan’s stable yields, thereby increasing the yen’s attractiveness.
USD/JPY is trading lower while currently near the support level. However, MACD has illustrated diminishing bearish momentum, while RSI is at 37, suggesting the pair might experience technical correction since the RSI rebounded sharply from oversold territory.
Resistance level: 156.05, 157.40
Support level: 154.80, 153.60
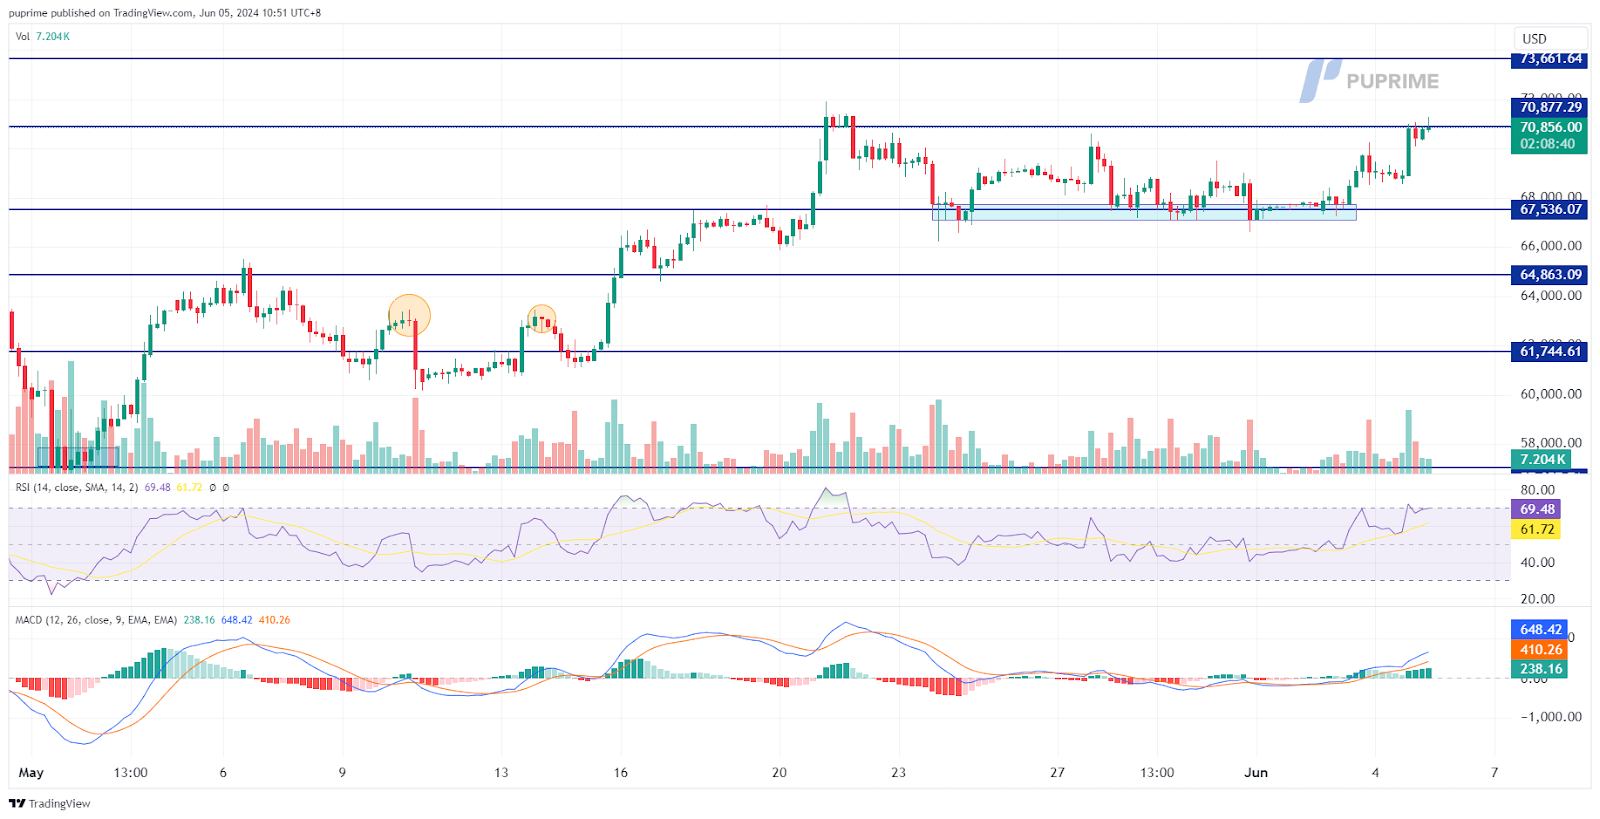
Bitcoin (BTC) continues to rally, rebounding from the liquidity zone to reach its highest levels since May. The cryptocurrency is buoyed by positive macroeconomic data suggesting that the Federal Reserve may soon cut interest rates, potentially stimulating the crypto market. Additionally, the Japanese crypto exchange DMM’s plan to raise more than $300 million to invest in BTC has boosted optimism for Bitcoin and the broader crypto market.
BTC continues to rally to its highest level since May but faces a strong resistance at near $70900. The RSI is moving upward and is on the brink of breaking into the overbought zone, while the MACD has crossed above the zero line and is diverging, suggesting the bullish momentum is gaining.
Resistance level: 73660.00, 77090.00
Support level: 67540.00, 64860.00
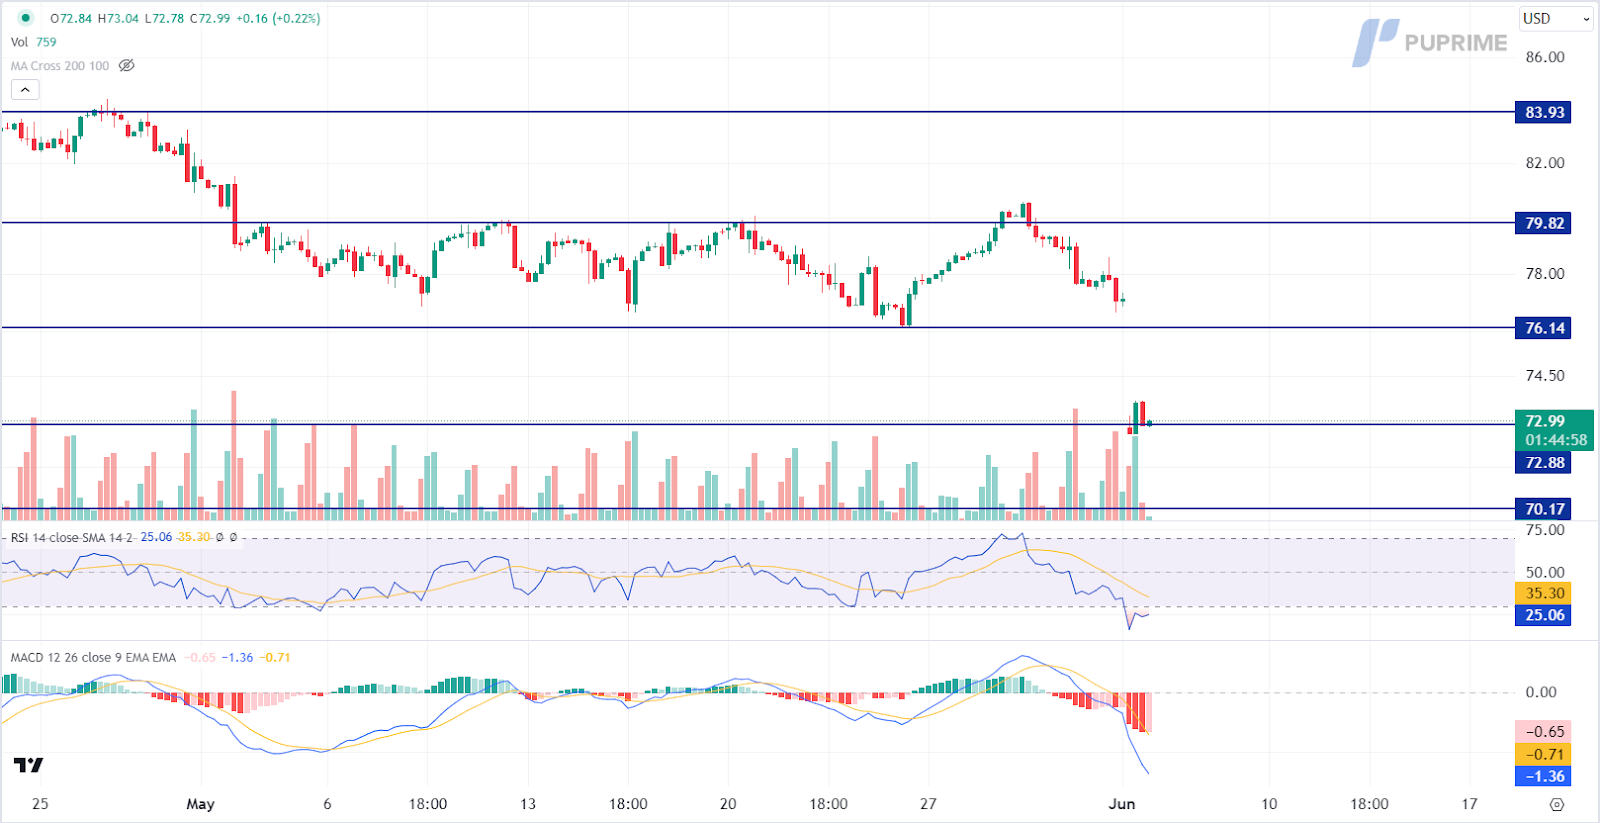
Crude oil prices experienced a significant decline, pressured by a gloomy global economic outlook. A series of worse-than-expected economic data releases from major economies, particularly the United States, have raised doubts about the robustness of the post-Covid-19 recovery. Despite OPEC+’s decision on Sunday to extend deep oil output cuts into 2025, the overall appeal for this black commodity remained pessimistic. Concerns over slow demand growth in China, the top oil importer, alongside rising oil inventories in developed economies, continue to weigh on prices.
Oil prices are trading lower while currently testing the support level. MACD has illustrated increasing bearish momentum. However, RSI is at 25, suggesting the commodity might enter oversold territory.
Resistance level: 76.15, 79.80
Support level: 72.90, 70.15

Trade with simulated capital and earn real profits after you pass our trader assessment.

20 May 2025, 06:46 Gold Slips as Ceasefire Hopes Curb Safe-Haven Demand

7 May 2025, 03:59 Geopolitical Risks and FOMC Uncertainty Shake Global Markets

6 May 2025, 05:53 Dollar Dips, Gold Rallies on U.S.-Taiwan Risk


New Registrations Unavailable
We’re not accepting new registrations at the moment.
While new sign ups are unavailable, existing users can continue their challenges and trading activities as usual.
Disclaimer: This website exclusively provides proprietary trading services. We do not engage in any regulated activities, offer investment management services, or manage funds on behalf of external clients. Our trading activities are conducted solely with the firm's own capital, and we do not accept client deposits or manage client accounts. It's important to note that none of the services we provide should be construed as investment or financial services in accordance with applicable laws.
This website offers services related to professional skill and experience assessment, which determine your eligibility to trade with the firm's capital. The outcome of these services is inherently determined by your individual skill level and ability to perform within the trading requirements and objectives outlined for each service separately. Clients are strongly advised to thoroughly understand the requirements of the services before signing up for any.
The content provided on this website is for informational purposes only and does not constitute financial, investment, or trading advice. The information presented is based on sources believed to be reliable, but we do not guarantee its accuracy, completeness, or timeliness. We disclaim any liability for any loss or damage arising directly or indirectly from the use of or reliance on the information provided on this website.
This website is not directed to residents of certain jurisdictions such as the United States, Singapore, Australia, China and some other specified regions, and is not intended for distribution to, or use by, any person in any countries or jurisdictions where such distribution or use would be contrary to local law or regulation.
This website is owned by Finzero Cap Ltd, a company incorporated in the Republic of Cyprus under registration number HE414308, with its registered office at 62 Athalassas, Mezzanine, Strovolos 2012, Nicosia, Cyprus. Finzero Cap Ltd serves as the authorized representative for PU Prime Ltd.
