Join the PU Xtrader Challenge Today
Trade with simulated capital and earn real profits after you pass our trader assessment.
Join the PU Xtrader Challenge Today
Trade with simulated capital and earn real profits after you pass our trader assessment.
23 July 2024,05:41
Daily Market Analysis
23 July 2024, 05:41
*Wall Street Rebound ahead of Mega Caps’ earning reports including Alphabet and Tesla.
*New Zealand dollar trades in a significant bearish momentum as the RBNZ dovish pivot weighs on the Kiwi.
Wall Street rallied in the last session as investors anticipate earnings reports from mega-caps including Alphabet and Tesla, due later today. Mitigated U.S. political uncertainty and renewed confidence in the U.S. economy, especially if Donald Trump is re-elected in the upcoming presidential election, have bolstered the equity market’s upward momentum.
In the forex market, the dollar index (DXY) remained relatively quiet, failing to break its next resistance level at 104.45, and is awaiting a catalyst for a breakout. Meanwhile, currencies from Oceania, including the Aussie and Kiwi, have weakened significantly. Market anticipation of rate cuts from their respective central banks and concerns over China’s lacklustre economic performance have weighed heavily on both currencies.
In the commodity market, gold slid to its lowest level in a week before climbing back above $2,400, while oil prices continued to trade within a bearish trajectory. Traders are also looking ahead to the eurozone and UK PMI readings, due tomorrow, to gauge the strength of the Sterling and the euro, both of which have lacked a catalyst in recent sessions.
Current rate hike bets on 31st July Fed interest rate decision:
Source: CME Fedwatch Tool0 bps (93.3%) VS -25 bps (6.7%)
The Dollar Index, which trades against a basket of six major currencies, remained flat as investors digested the news of Biden’s withdrawal and awaited several crucial economic events. The upcoming week promises to be eventful, with key economic indicators set to be released. The focus will be on the preliminary GDP data for the second quarter, with many economists expecting an uptick. Additionally, the Personal Consumption Expenditures (PCE) data, a preferred inflation gauge for the Fed, will be released on Friday.
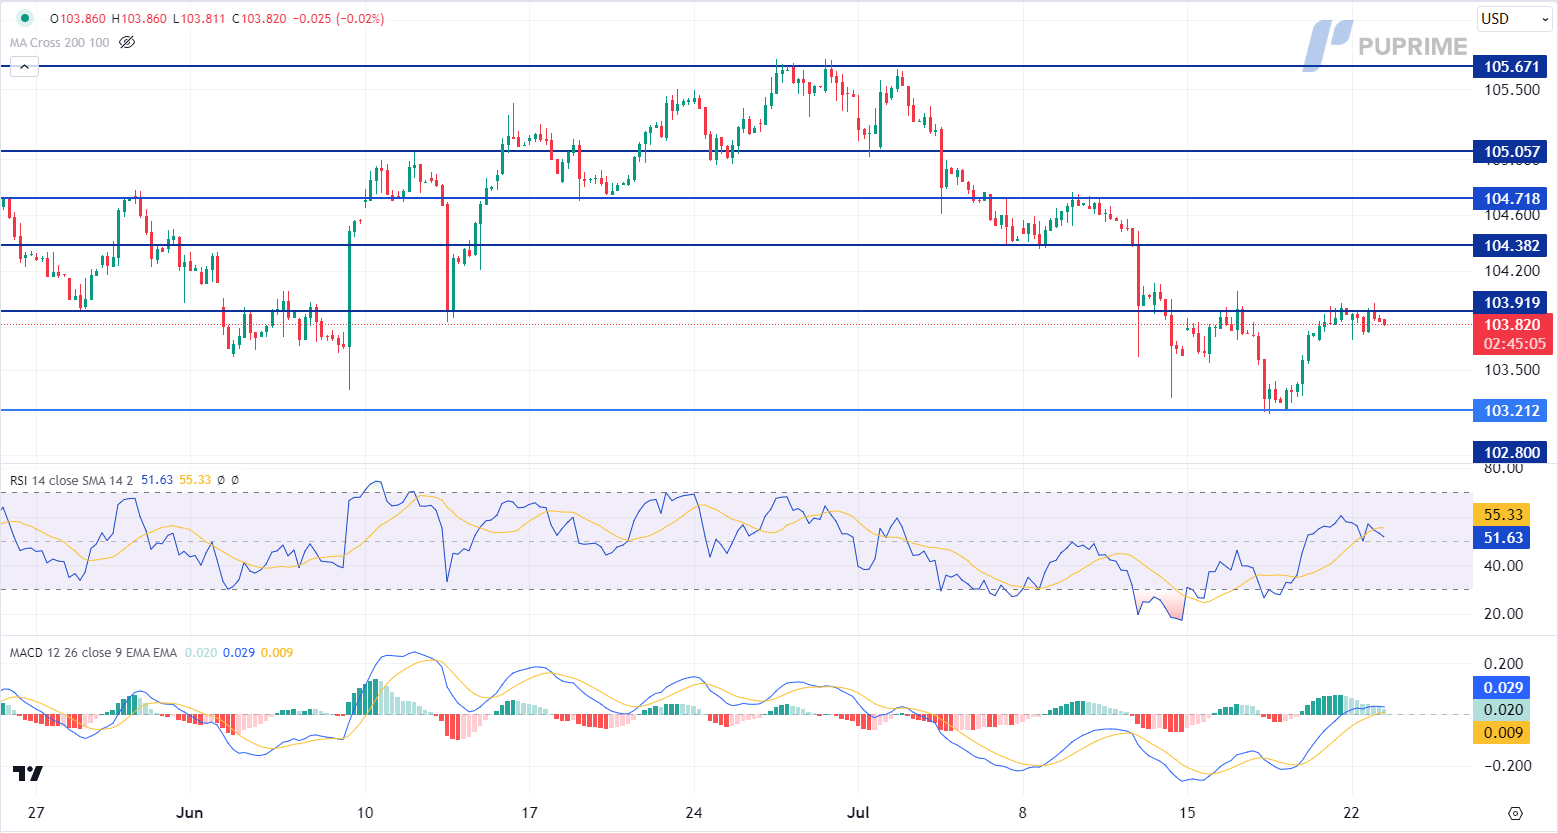
The dollar index is trading higher while currently testing the resistance level. However, MACD has illustrated diminishing bullish momentum, while RSI is at 51, suggesting the index might experience technical correction since the RSI retreated sharply from overbought territory.
Resistance level: 103.90, 104.40
Support level: 104.05, 102.80
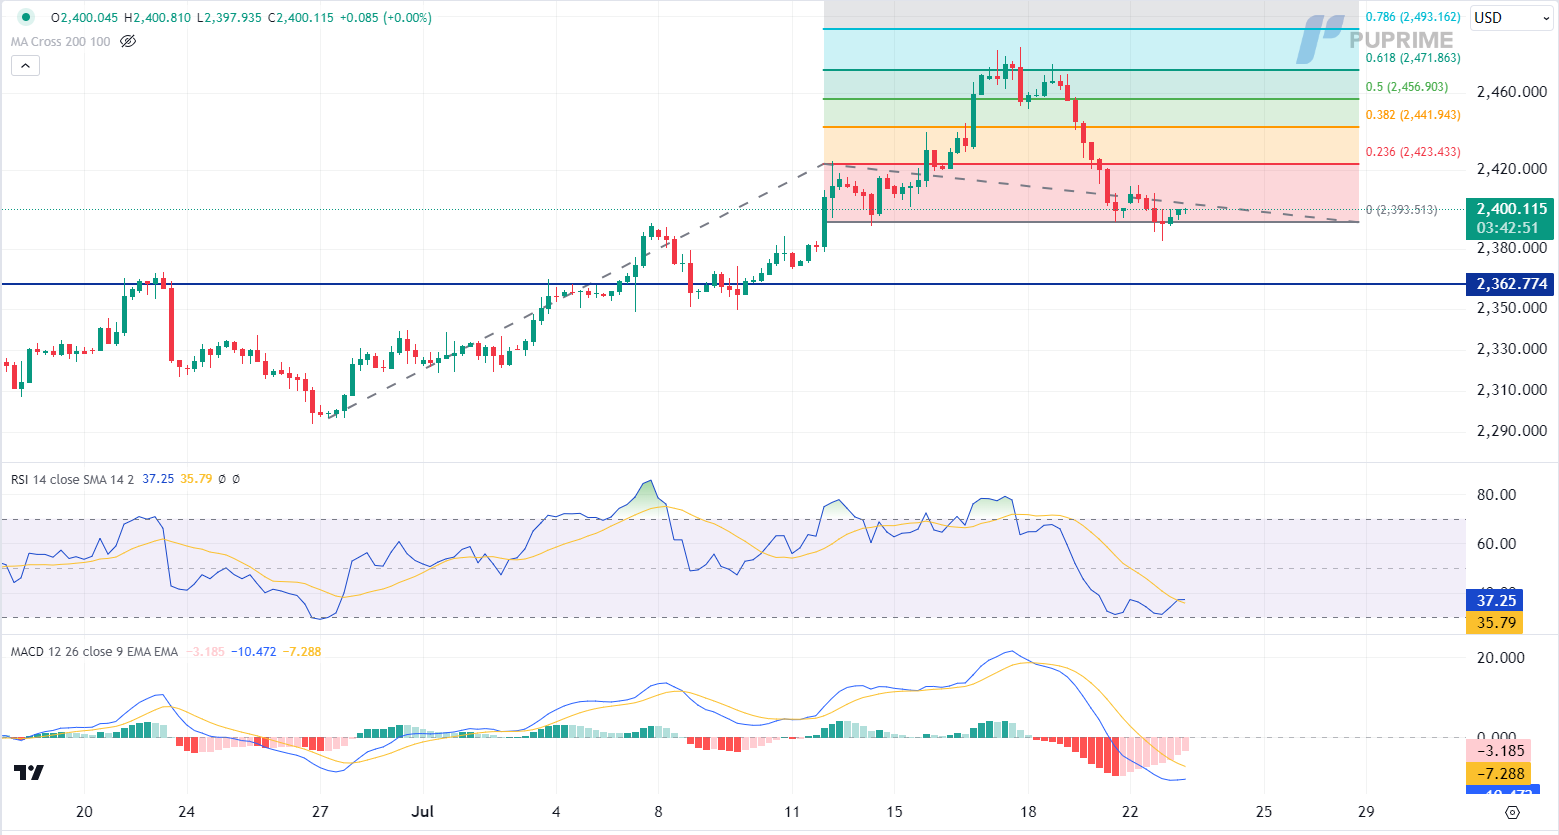
Gold prices experienced a slight rebound due to technical correction and bargain buying amidst rising uncertainties over the US Presidential elections. However, analysts expect the overall trend for gold to be slow as investors await crucial US economic data to gauge the likely movement of gold prices.
Gold prices are trading lower while currently testing the support level. However, MACD has illustrated diminishing bearish momentum, while RSI is at 37, suggesting the commodity might enter oversold territory.
Resistance level: 2425.00, 2440.00
Support level: 2395.00, 2365.00
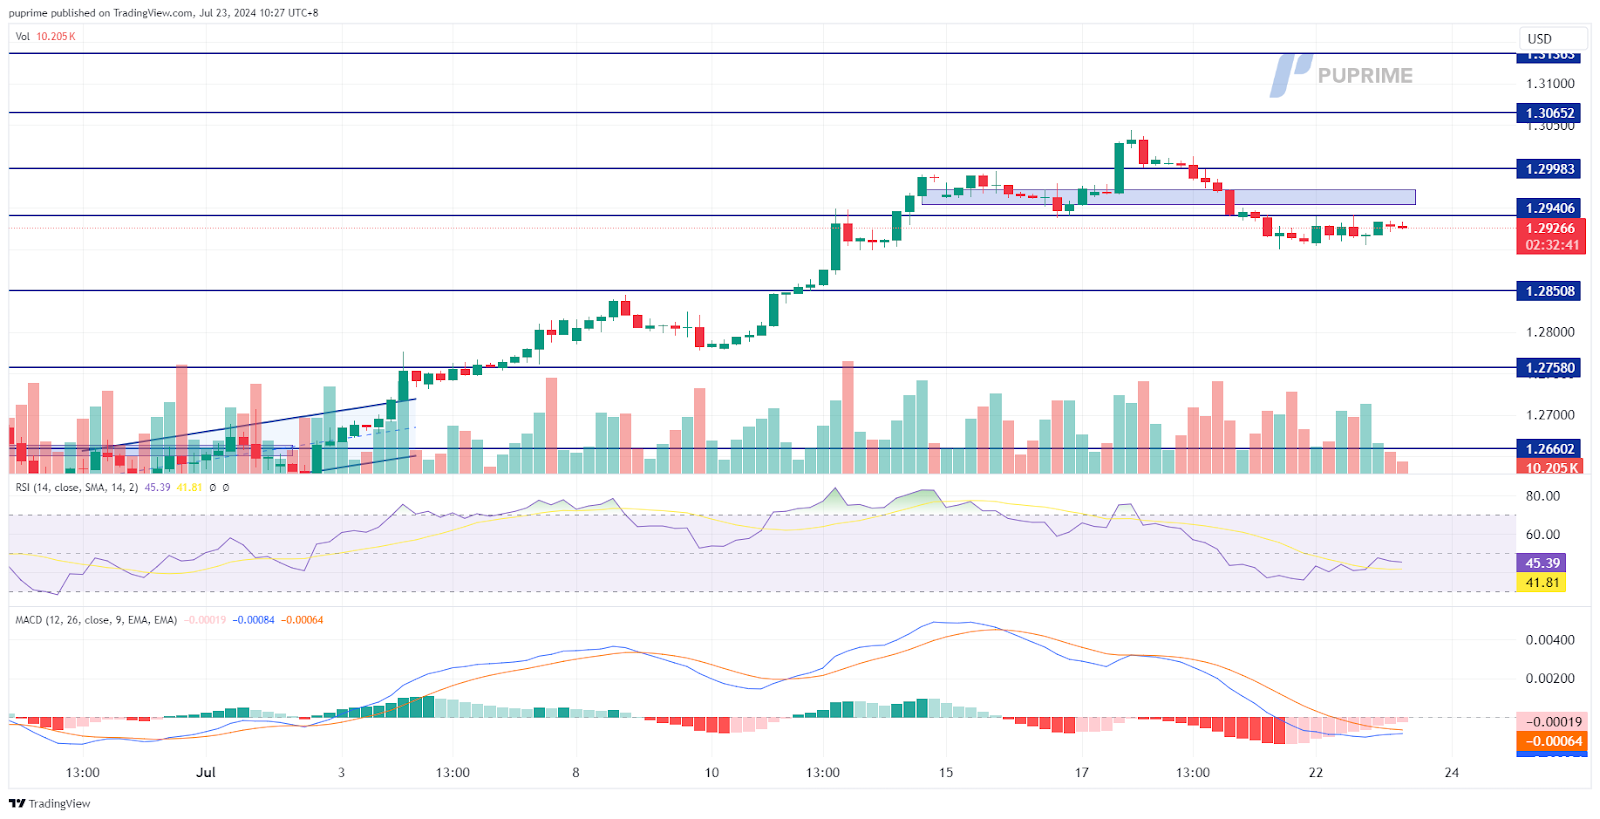
The GBP/USD pair has traded sideways for the past few sessions, lacking a significant catalyst. The dollar index (DXY) remains constrained below the 104.40 level, suggesting that the bullish momentum for the dollar has eased, potentially providing buoyancy for the pair. Sterling traders are now eyeing tomorrow’s UK PMI reading, which could serve as the catalyst needed to push the pair above its current level.
The pair remains below its key resistance liquidity zone at near 1.2960, suggesting a bearish bias. The RSI remains flowing below the 50 level, while the MACD has broken below the zero line, suggesting the bearish momentum is overwhelming the pair.
Resistance level: 1.2990, 1.3065
Support level: 1.2850, 1.2760
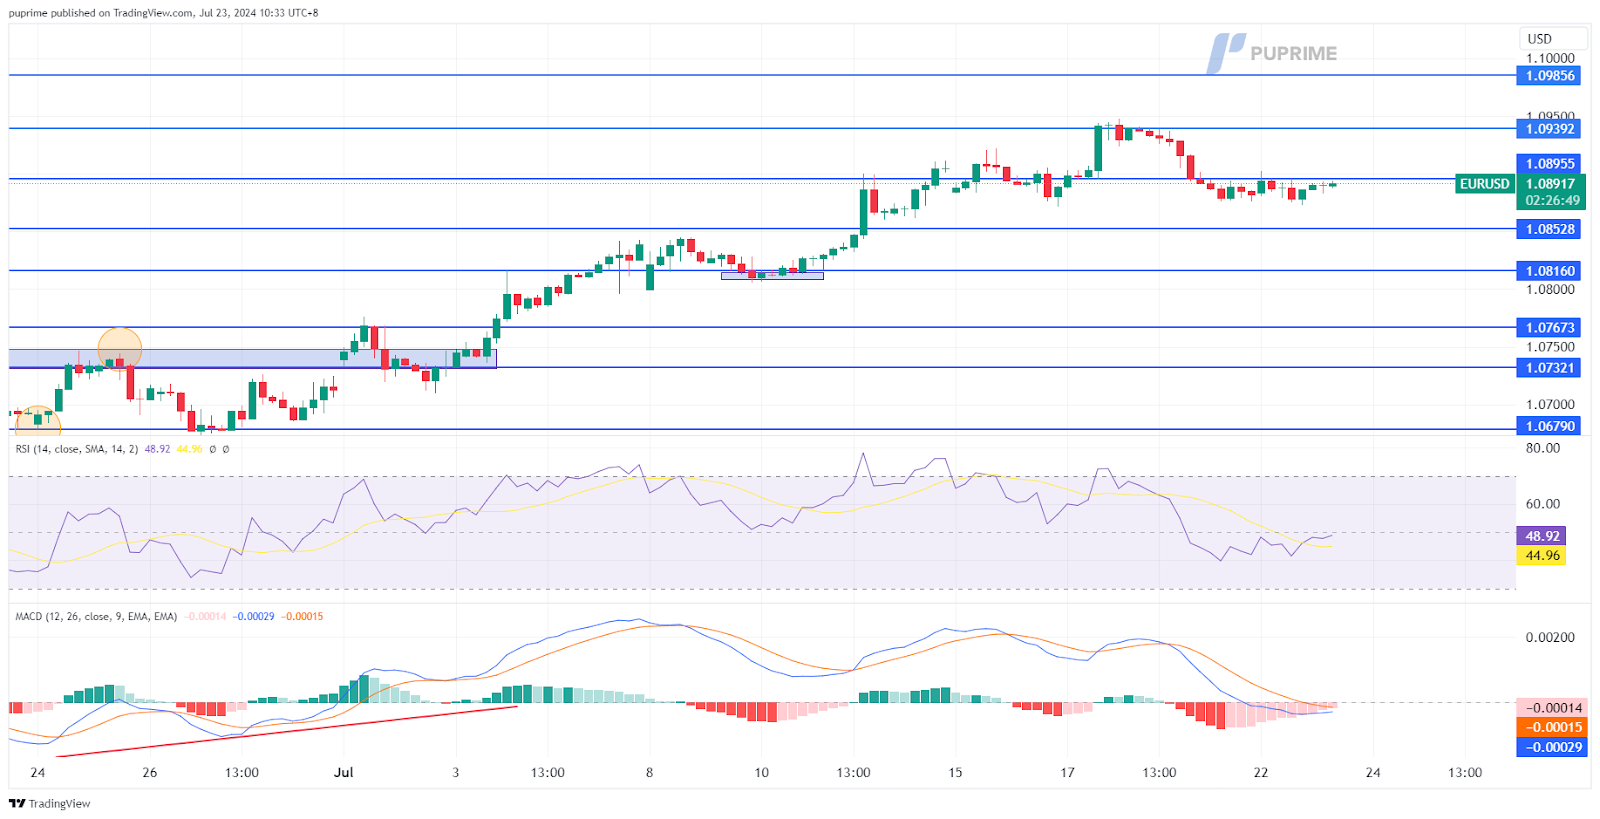
The euro has been trading sideways, awaiting a catalyst to pick a direction. The recent Eurozone CPI reading of 2.5% has provided buoyancy for the euro, as the market has hawkish expectations for the ECB’s upcoming monetary policy moves, given the persistently high inflation in the region. Meanwhile, the Eurozone PMI reading is due tomorrow and is expected to impact the pair’s price movement.
EUR/USD has been trading relatively flat for the past few sessions, and the pair has been given a neutral signal. The RSI has been flowing close to the 50 level, while the MACD is on the brink of breaking below the zero line, suggesting that the bearish momentum remains intact.
Resistance level: 1.0940, 1.0995
Support level: 1.0875, 1.0795
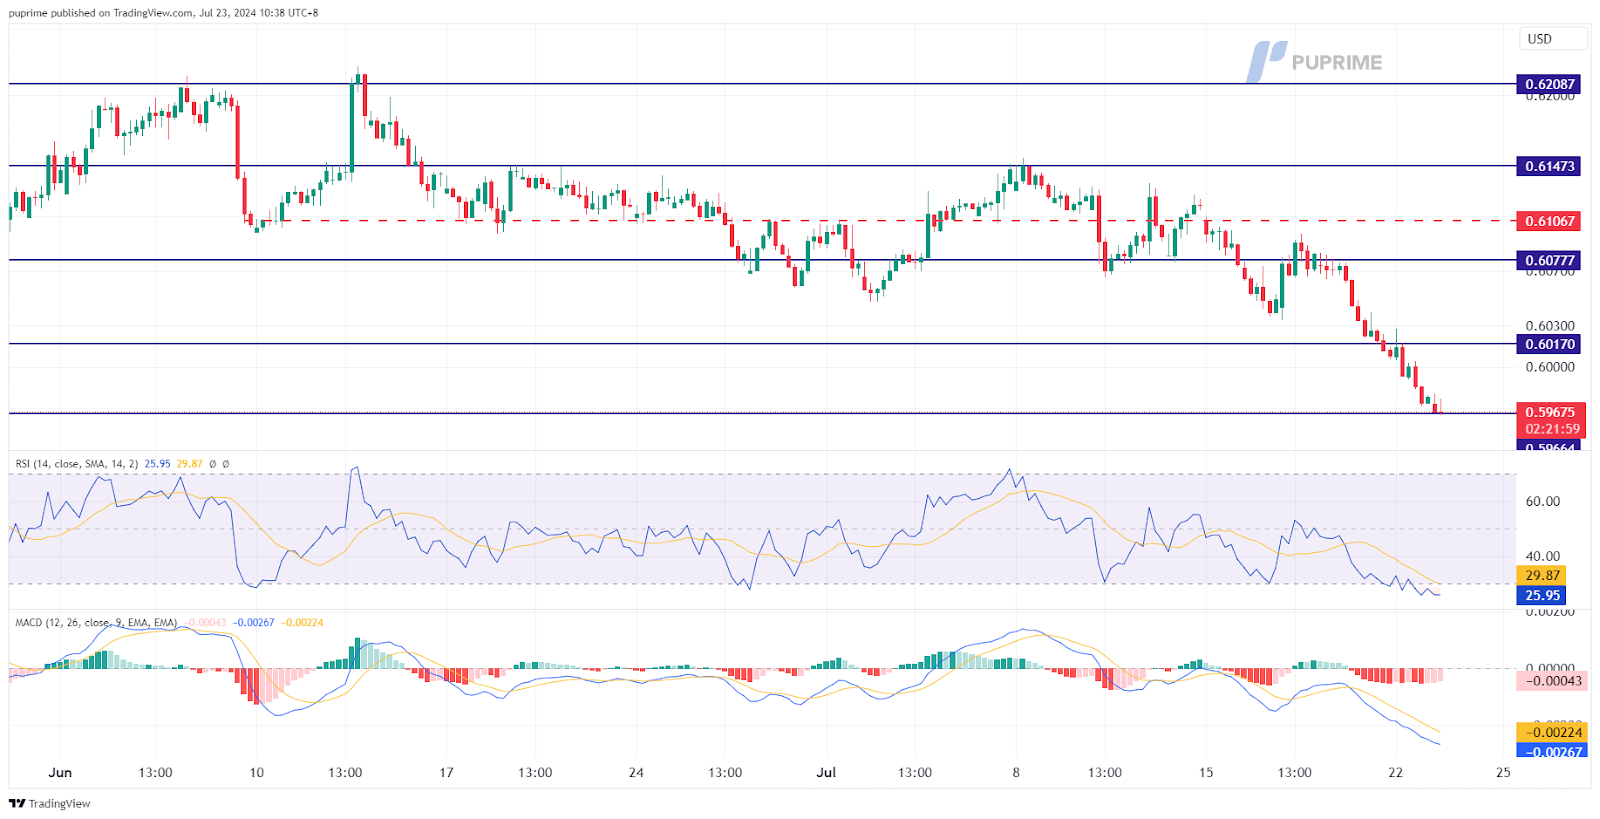
The NZD/USD pair has slid to its lowest level since May, with the New Zealand dollar’s strength hindered by multiple factors. The market has a dovish outlook on the RBNZ’s upcoming monetary policy due to rising recession risks. Additionally, concerns over China’s lacklustre economic growth have weighed on the New Zealand dollar, often seen as a proxy currency for China. A break below the current support level at 0.5970 would serve as a solid bearish signal for the pair.
The pair has slid for the past three sessions, suggesting it is trading with strong selling pressure. The RSI has dropped into the oversold zone, while the MACD edged lower and is diverging, suggesting bearish momentum is gaining.
Resistance level: 0.6020, 0.6080
Support level: 0.5906, 0.5865
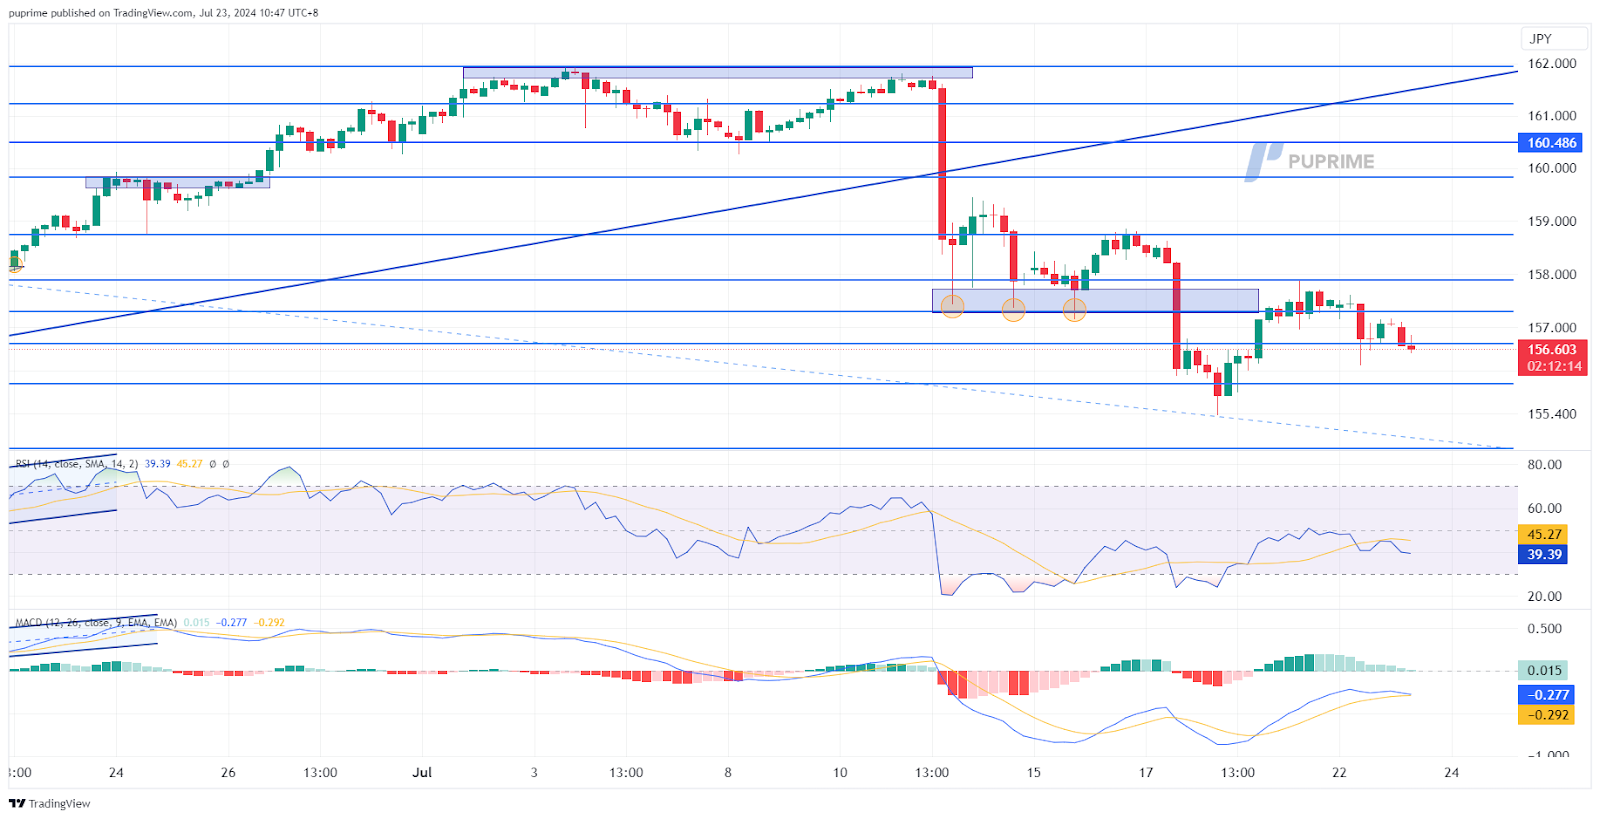
The Japanese Yen has strengthened in the past session against its peers after the market digested the Japanese CPI reading released last Friday. The CPI reading came in higher than the previous at 2.6%, suggesting that the inflation rate in the country is sustainable and may allow the BoJ to raise rates further. Meanwhile, Japanese Yen traders are eyeing tomorrow’s PMI reading as well as Friday’s Tokyo CPI reading to gauge the BoJ’s interest rate decision due on 31st July.
The pair was rejected at its liquidity zone near the 157.60 level, suggesting a bearish bias for the pair. The RSI remains flowing at the lower region while the MACD has signs to cross below the zero line, suggesting that bearish momentum is forming.
Resistance level: 157.30, 157.90
Support level: 155.95, 154.75
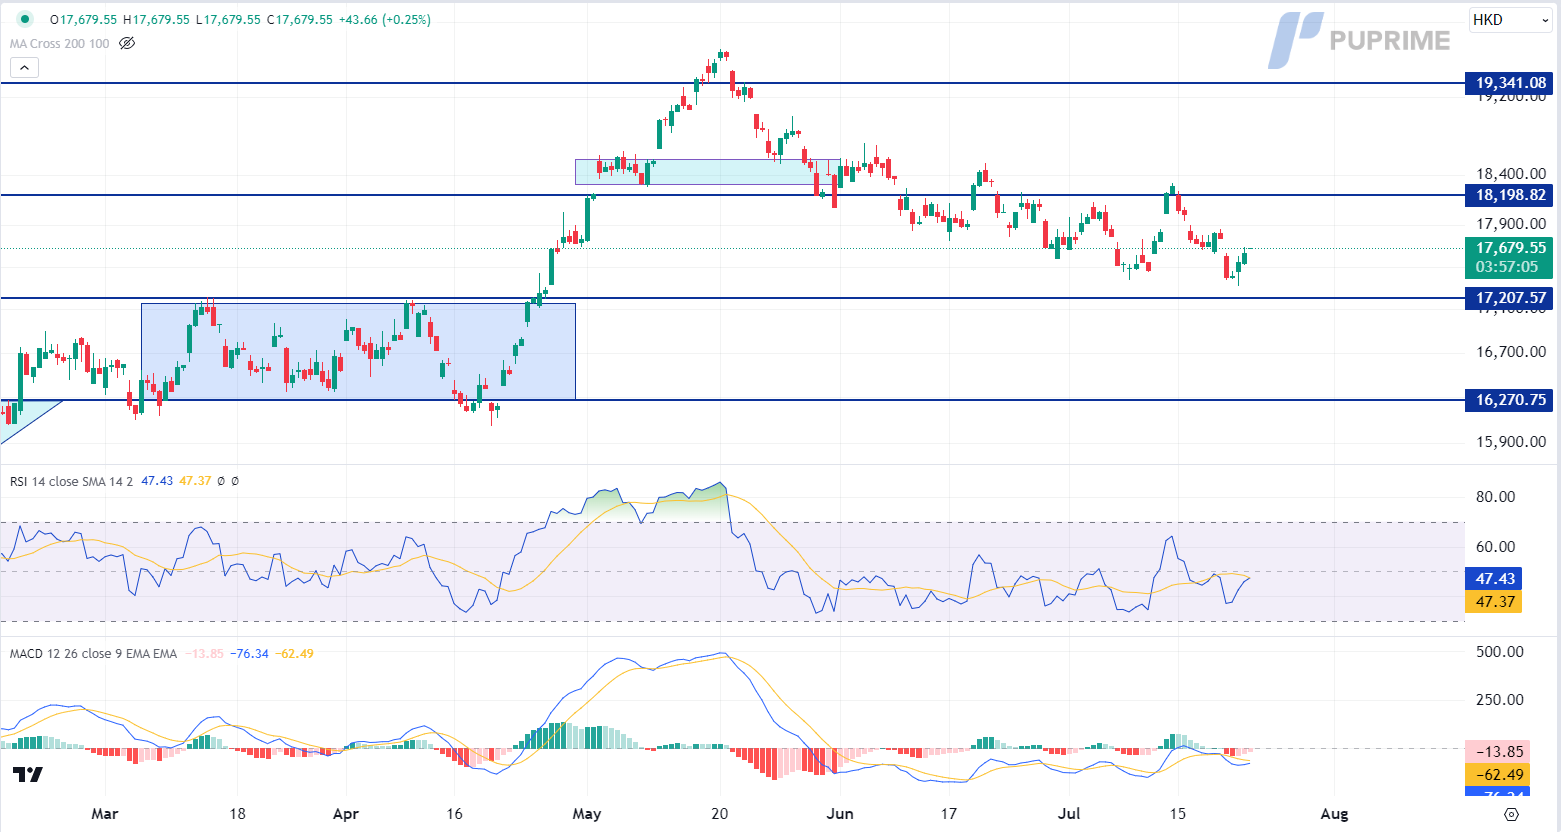
The Hang Seng Index and other Chinese equities markets extended gains following the People’s Bank of China’s unexpected cut in key lending rates, underscoring Beijing’s urgency to speed up reforms. The central bank reduced the seven-day reverse repo rate to 1.7% from 1.8%, the one-year loan prime rate to 3.35% from 3.45%, and the five-year loan prime rate to 3.85% from 3.95%. These rate cuts are aimed at “strengthening counter-cyclical adjustments to better support the real economy,” according to the PBOC. This stimulus has further supported Chinese equities, prompting a rebound in these asset classes.
The Hang Seng Index is trading high following the prior rebound from the support level. MACD has illustrated diminishing bearish momentum, while RSI is at 47, suggesting the index might extend its gains since the RSI rebounded sharply from oversold territory.
Resistance level: 18200.00, 19340.00
Support level: 17210.00, 16270.00
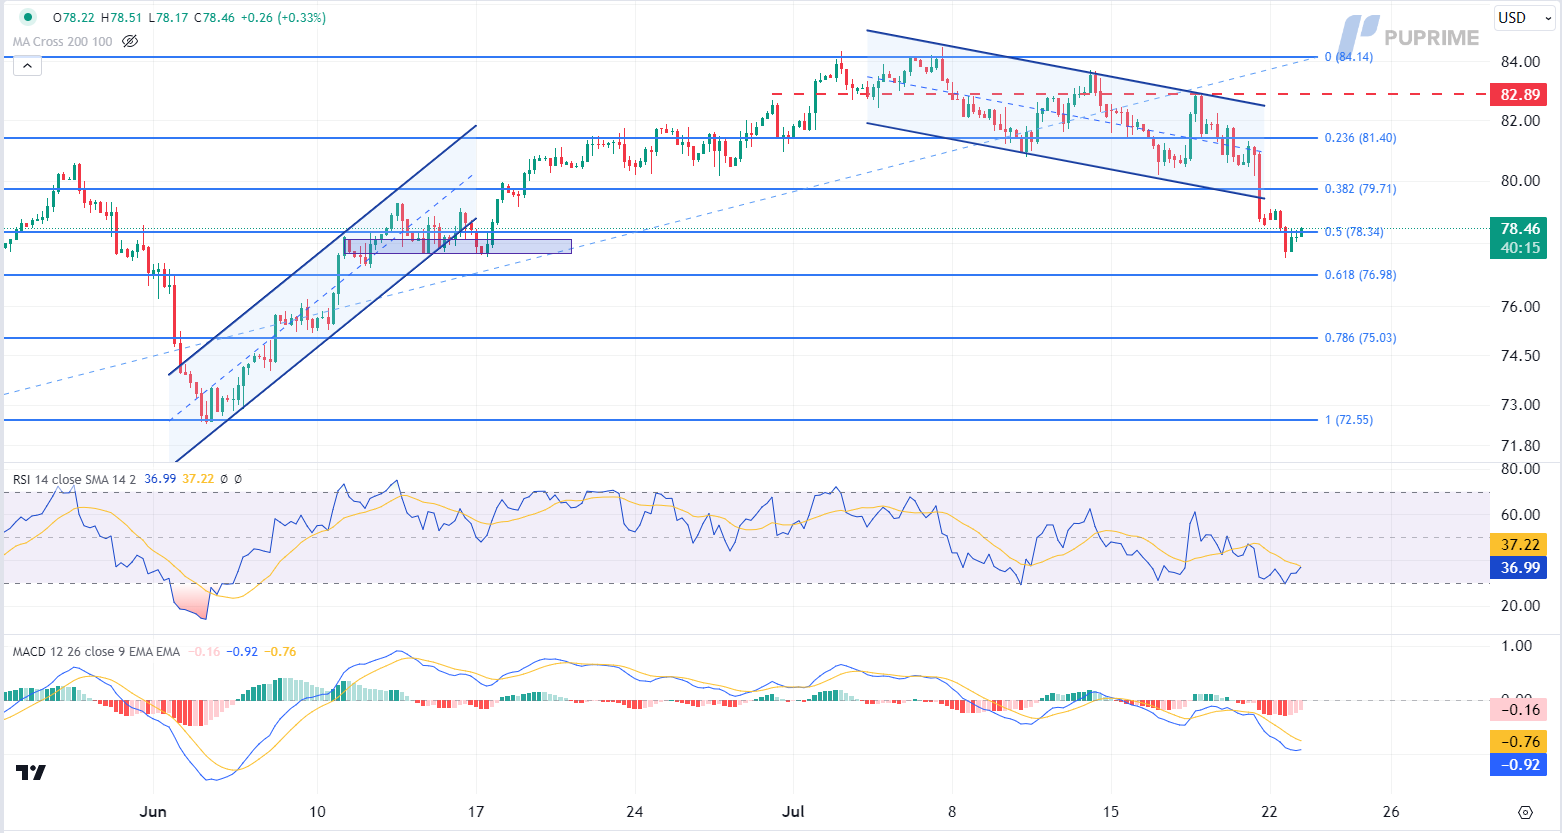
Oil prices continue to extend their losses as diminishing risk appetite in the global financial market sparks a selloff. Biden’s withdrawal from the election and his endorsement of Vice President Kamala Harris has added to the political uncertainty, causing investors to sell off high-risk oil assets. Additionally, concerns over China’s economic growth persist despite Beijing’s vow to implement more stimulus measures to shore up growth.
Oil prices are trading higher following the prior rebound from the support level. MACD has illustrated diminishing bearish momentum, while RSI is at 37, suggesting the commodity might extend its gain since the RSI rebounded sharply from oversold territory.
Resistance level: 79.70, 81.40
Support level: 78.35, 77.00

Trade with simulated capital and earn real profits after you pass our trader assessment.

20 May 2025, 06:46 Gold Slips as Ceasefire Hopes Curb Safe-Haven Demand

7 May 2025, 03:59 Geopolitical Risks and FOMC Uncertainty Shake Global Markets

6 May 2025, 05:53 Dollar Dips, Gold Rallies on U.S.-Taiwan Risk


New Registrations Unavailable
We’re not accepting new registrations at the moment.
While new sign ups are unavailable, existing users can continue their challenges and trading activities as usual.
Disclaimer: This website exclusively provides proprietary trading services. We do not engage in any regulated activities, offer investment management services, or manage funds on behalf of external clients. Our trading activities are conducted solely with the firm's own capital, and we do not accept client deposits or manage client accounts. It's important to note that none of the services we provide should be construed as investment or financial services in accordance with applicable laws.
This website offers services related to professional skill and experience assessment, which determine your eligibility to trade with the firm's capital. The outcome of these services is inherently determined by your individual skill level and ability to perform within the trading requirements and objectives outlined for each service separately. Clients are strongly advised to thoroughly understand the requirements of the services before signing up for any.
The content provided on this website is for informational purposes only and does not constitute financial, investment, or trading advice. The information presented is based on sources believed to be reliable, but we do not guarantee its accuracy, completeness, or timeliness. We disclaim any liability for any loss or damage arising directly or indirectly from the use of or reliance on the information provided on this website.
This website is not directed to residents of certain jurisdictions such as the United States, Singapore, Australia, China and some other specified regions, and is not intended for distribution to, or use by, any person in any countries or jurisdictions where such distribution or use would be contrary to local law or regulation.
This website is owned by Finzero Cap Ltd, a company incorporated in the Republic of Cyprus under registration number HE414308, with its registered office at 62 Athalassas, Mezzanine, Strovolos 2012, Nicosia, Cyprus. Finzero Cap Ltd serves as the authorized representative for PU Prime Ltd.
