Join the PU Xtrader Challenge Today
Trade with simulated capital and earn real profits after you pass our trader assessment.
Join the PU Xtrader Challenge Today
Trade with simulated capital and earn real profits after you pass our trader assessment.
16 July 2024,05:25
Daily Market Analysis
16 July 2024, 05:25
* Dow Jones rallied to All-time high on Dovish Powell’s statement yesterday.
*Gold jumped to near its all-time high level on a softening dollar.
*Eyes on today’s U.S. Retail Sales reading to gauge the dollar’s strength.
As we step into the earnings report season, the U.S. equity market rallied, with the Dow Jones climbing to its highest point in the last session, gaining over 200 points. The aftermath of Donald Trump’s shooting incident has influenced the equity market, compounded by a dovish statement from Jerome Powell indicating that inflation is trending towards the 2% target, as shown by the second-quarter economic data. Despite geopolitical issues in the country, the safe-haven dollar has been hindered by the Fed’s dovish stance.
Gold took advantage of the softened dollar, reaching its highest level in two months at $2,439.75 before retracing. Meanwhile, oil prices are under pressure due to pessimistic Chinese economic data. Traders should keep an eye on today’s U.S. Retail Sales reading, which could impact the dollar’s strength, while positioning themselves for tomorrow’s UK and Eurozone CPI readings.
Current rate hike bets on 31st July Fed interest rate decision:
Source: CME Fedwatch Tool0 bps (93.3%) VS -25 bps (6.7%)
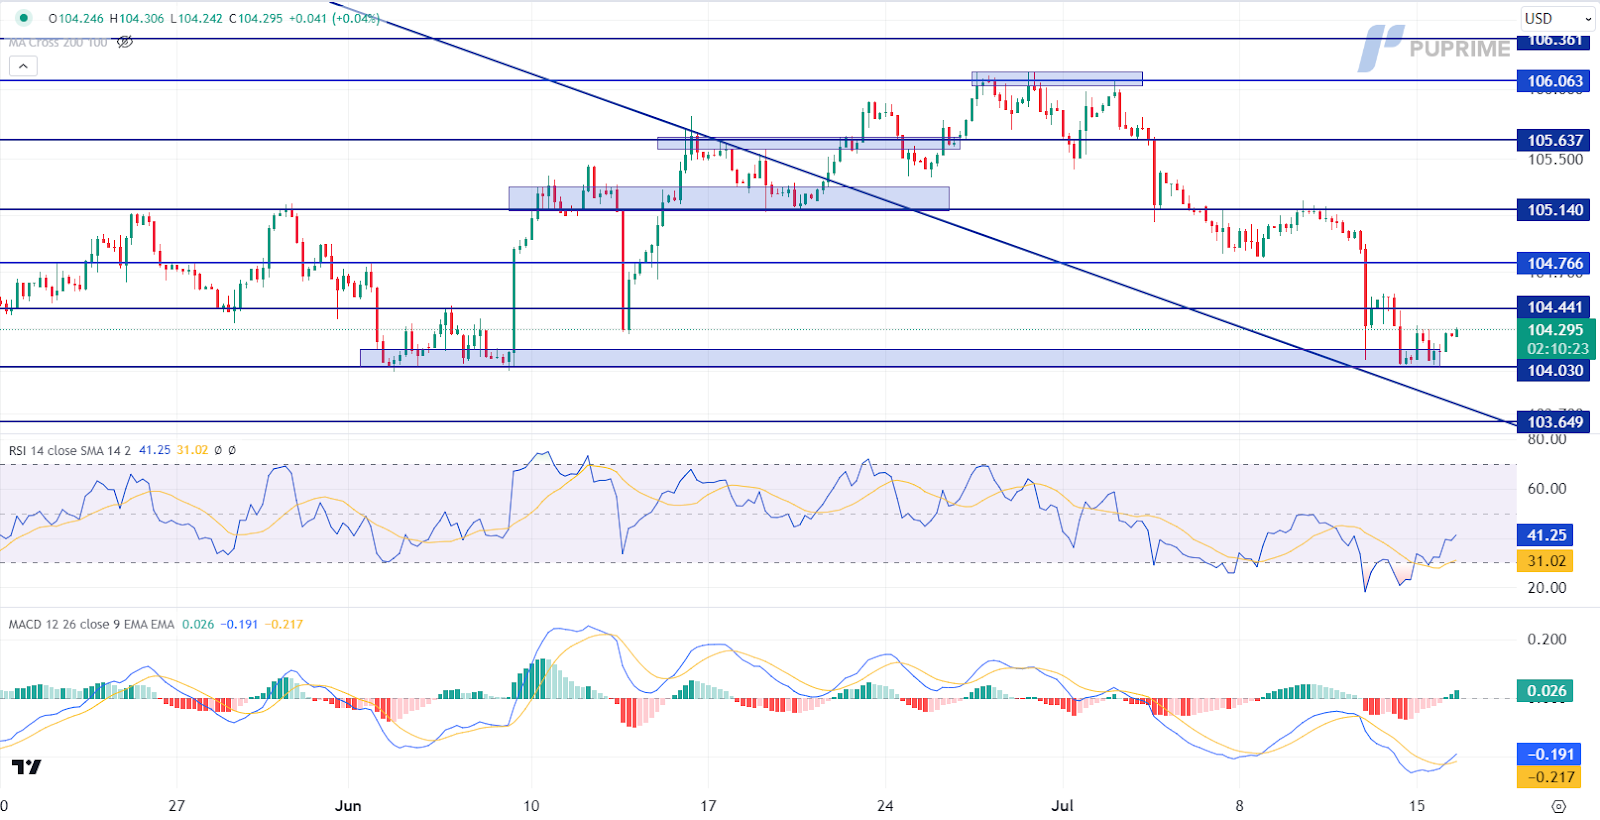
The Dollar Index, which tracks the US dollar against a basket of six major currencies, extended its losses after Fed Chair Jerome Powell suggested that recent downbeat inflation readings have increased the Fed’s confidence in bringing down inflation. This hints that the Fed is moving closer to rate cuts. However, Powell did not provide any guidance on the timing of interest rate moves, stating that decisions will be made on a meeting-by-meeting basis. With the recent slowdown in inflation and a stable labor market, investors will focus on the FOMC interest rates meeting in two weeks for further trading signals.
The dollar index is trading higher following the prior rebound from the support level. MACD has illustrated increasing bullish momentum, while RSI is at 41, suggesting the index might extend its gains since the RSI rebounded sharply from oversold territory.
Resistance level: 104.45, 104.75
Support level: 104.05, 103.65
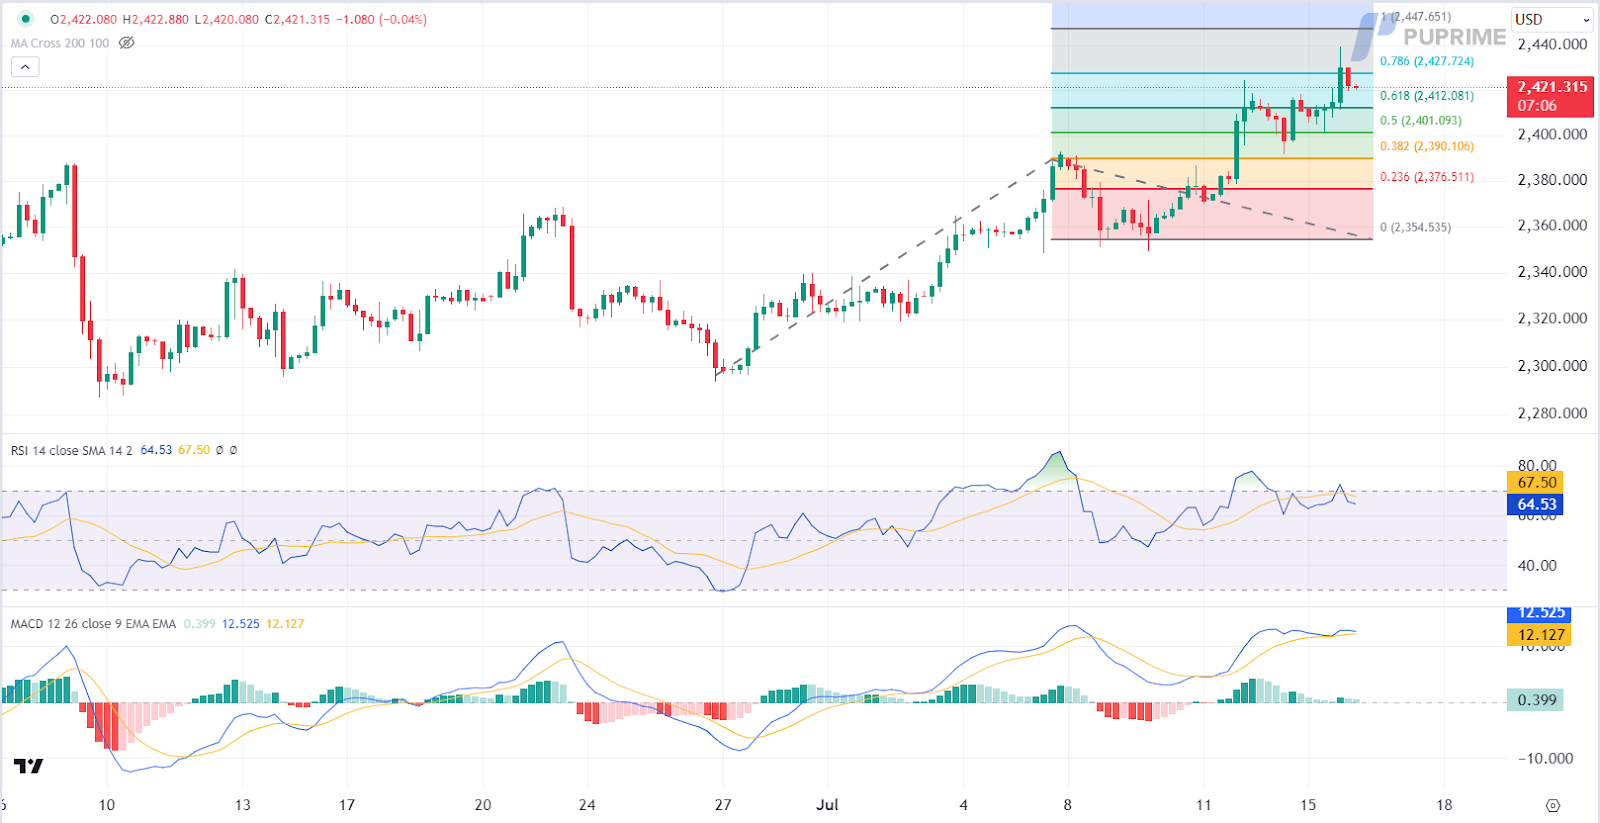
Gold prices extended their gains, buoyed by risk-off sentiment in the global market ahead of the US Presidential elections. Following the recent assassination attempt on Trump, investors remain concerned that the election could increase uncertainties. Additionally, the recent slowdown in US inflation has increased the odds of the Fed easing its monetary policy further, supporting dollar-denominated gold.
Gold prices are trading higher while currently near the resistance level. However, MACD has illustrated diminishing bullish momentum, while RSI is at 64, suggesting the commodity might experience technical correction since the RSI retreated sharply from overbought territory.
Resistance level: 2430.00, 2445.00
Support level: 2410.00, 2400.00
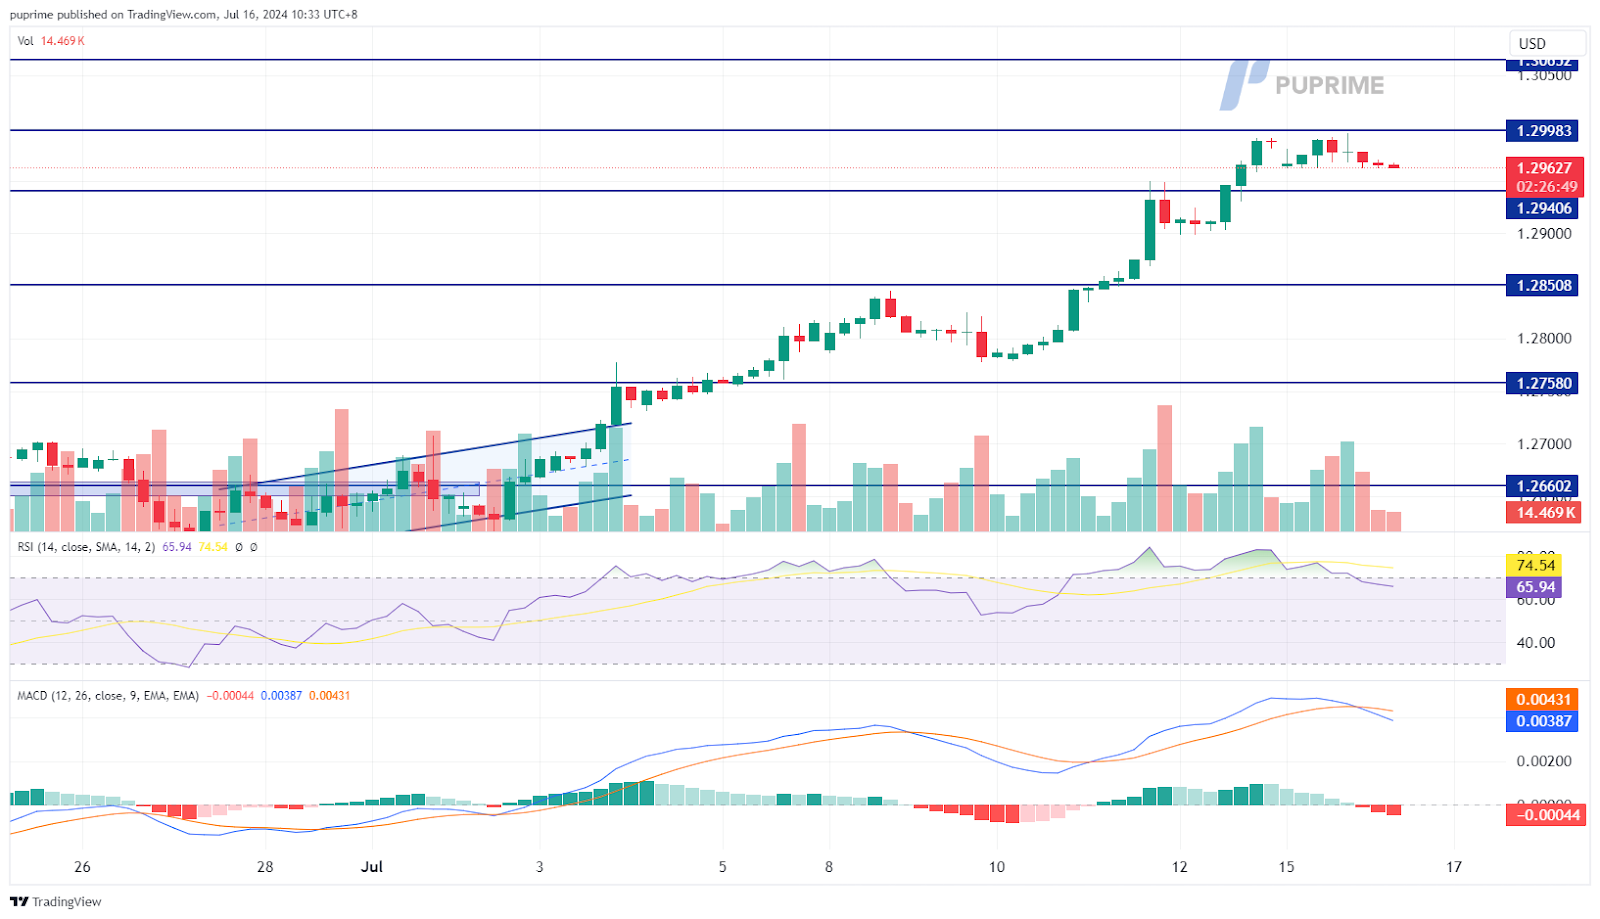
The GBP/USD pair faced strong resistance just below the 1.3000 level and is currently awaiting a catalyst to break above this psychological barrier. The geopolitical uncertainty in the U.S., following a gun-shooting incident at Donald Trump’s presidential election campaign in Pennsylvania, has created volatility. However, the dollar remains lacklustre, with market participants closely watching today’s Retail Sales reading, which could significantly impact the dollar’s strength.
The GBP/USD is currently facing resistance near the 1.3000 level and has traded sideways over the past few sessions. The RSI has dropped out from the overbought zone while the MACD has crossed on the above, suggesting the bullish momentum is easing.
Resistance level: 1.3000, 1.3065
Support level: 1.2940, 1.2850
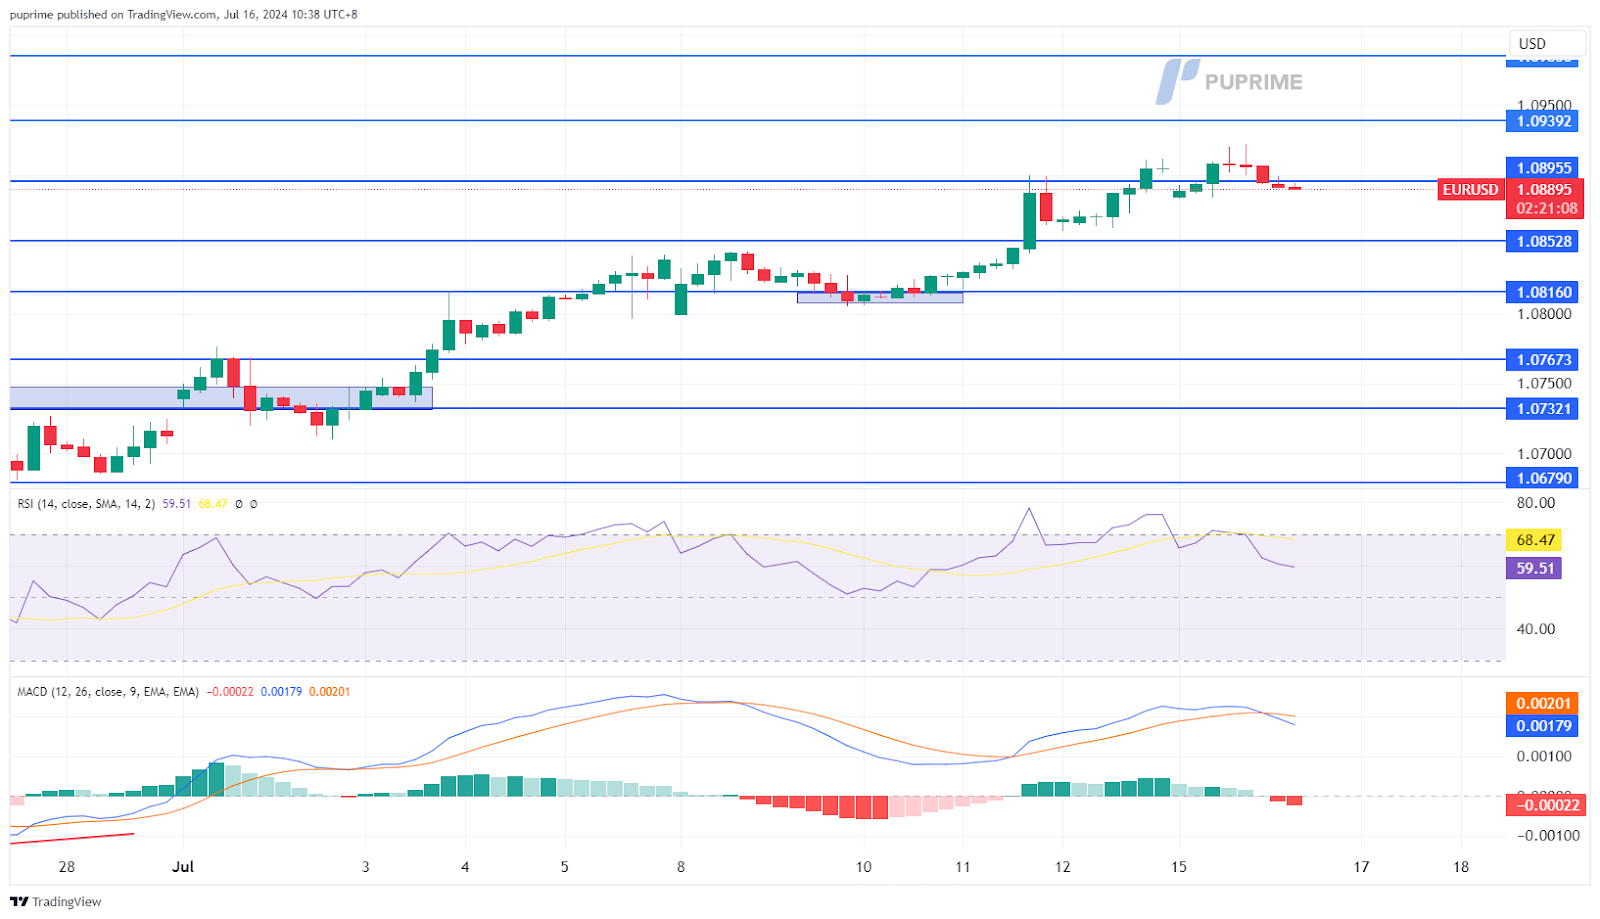
The EUR/USD pair traded sideways at its recent high, with profit-taking sentiment weighing on the pair whenever it hit above the 1.0900 level. The Fed Chair’s dovish statement yesterday, expressing confidence that inflation is heading down to the 2% target rate, has hindered the dollar’s strength and provided buoyancy for the pair.
EUR/USD stood pat in the last session at its recent high level, and the bullish momentum seemed to be easing. The RSI has dropped out from the overbought zone, while the MACD formed a double top and has crossed on the above, suggesting that the bullish momentum is easing.
Resistance level: 1.0940, 1.0985
Support level: 1.0853, 1.0816
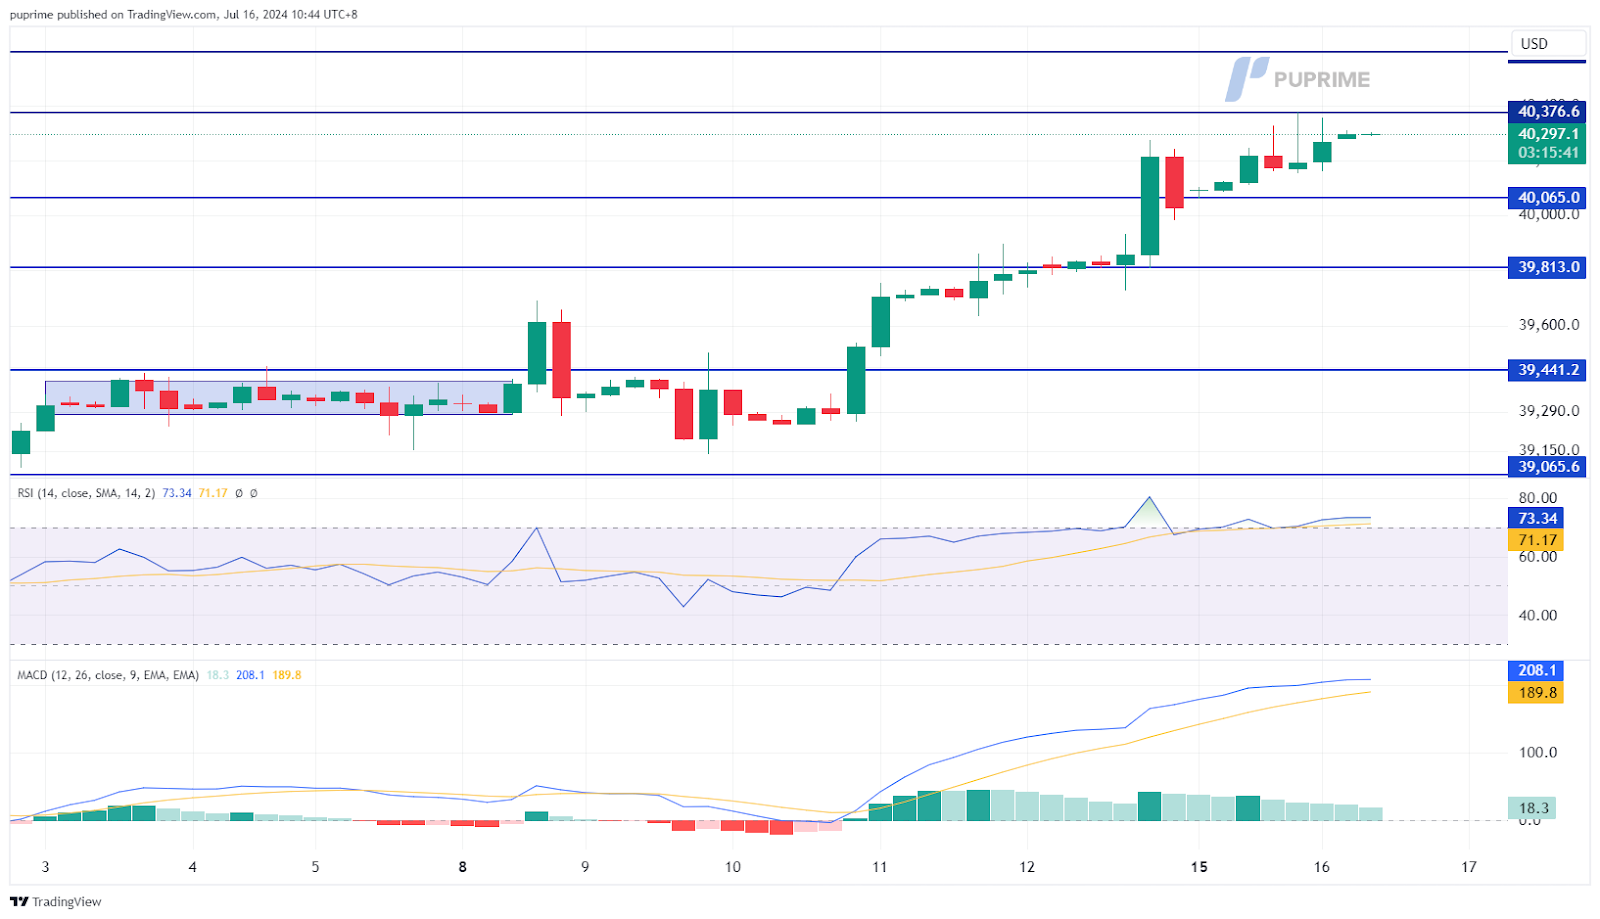
The Dow surged by more than 200 points in the last session, reaching an all-time high of 40,358.00. The assassination attempt on Trump during his presidential campaign had a positive effect on the market, as the leading candidate is believed to bolster market confidence. Additionally, the dovish statement from the Fed Chair yesterday has further fueled the upward momentum for the equity market.
The Dow remained trading with strong bullish momentum and stayed at its all-time high levels, suggesting a bullish signal for the index. The RSI remained in the overbought zone, while the MACD continued to edge higher, suggesting that the bullish momentum remained strong.
Resistance level: 40380.00, 40600.00
Support level: 40000.00, 39800.00
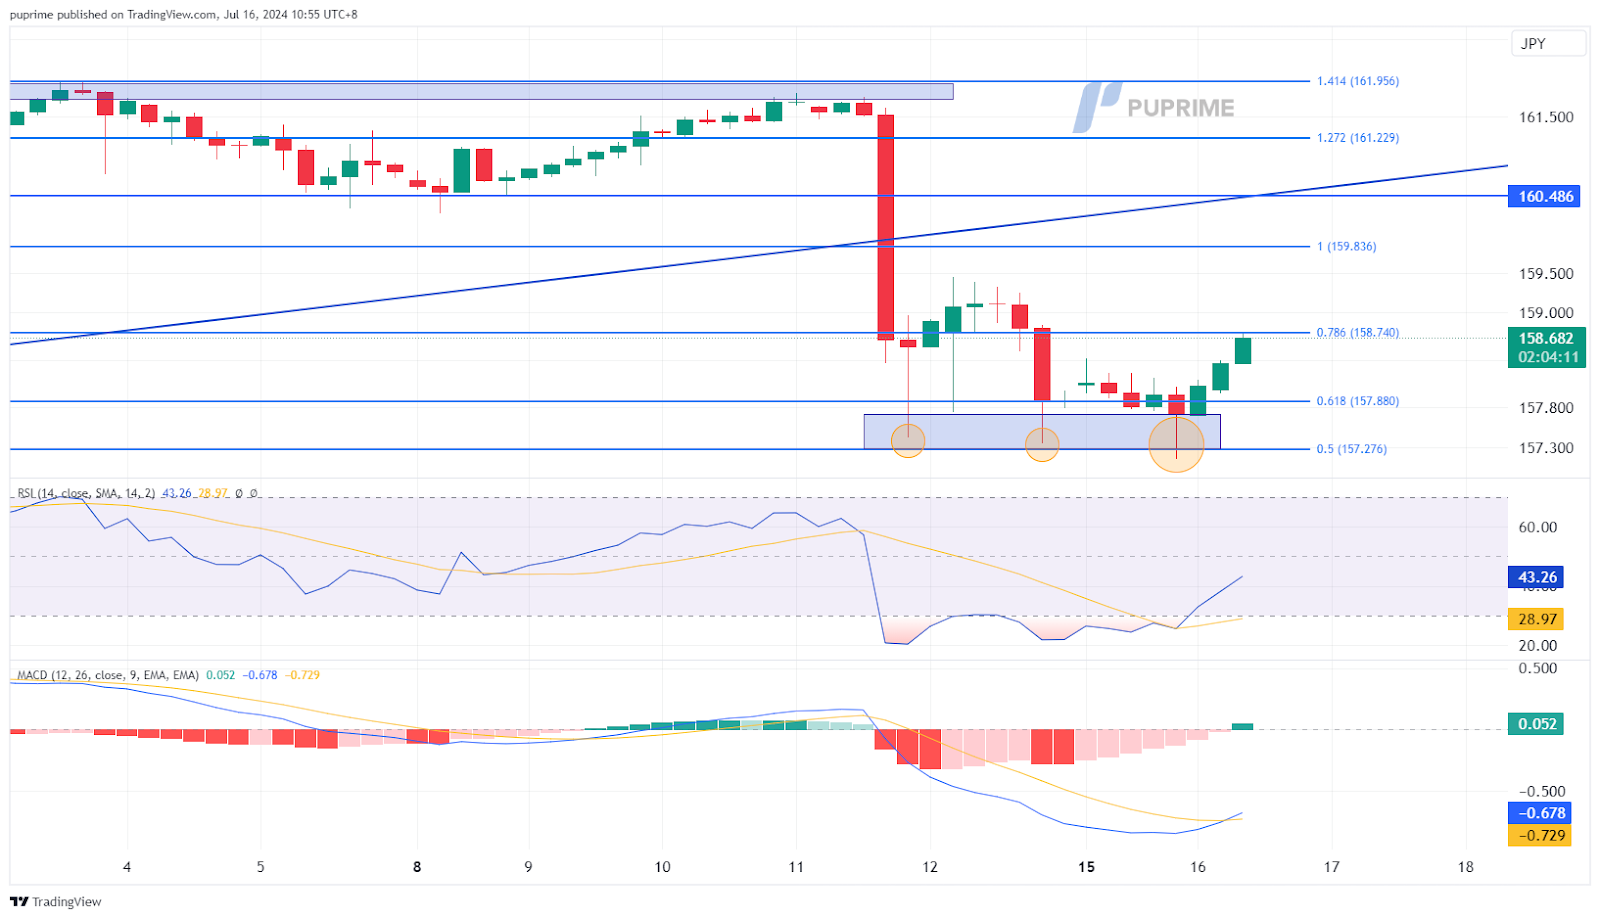
The USD/JPY is strongly supported above the 157.30 level and has begun to rebound, indicating a bullish bias for the pair. The dollar regained strength in the last session due to geopolitical uncertainty, while strong selling pressure on the Japanese yen presents a challenge for Japanese authorities in safeguarding their lacklustre currency. Meanwhile, Friday’s Japan National Core CPI is highly anticipated as it could be a pivotal point for the pair’s direction.
The pair has rebounded from its strong support level at near 158.00, suggesting a potential trend reversal signal. The RSI has surged above the oversold zone, while the MACD has crossed at the bottom, suggesting the bearish momentum is vanishing.
Resistance level: 159.80, 160.50
Support level:157.90, 157.30
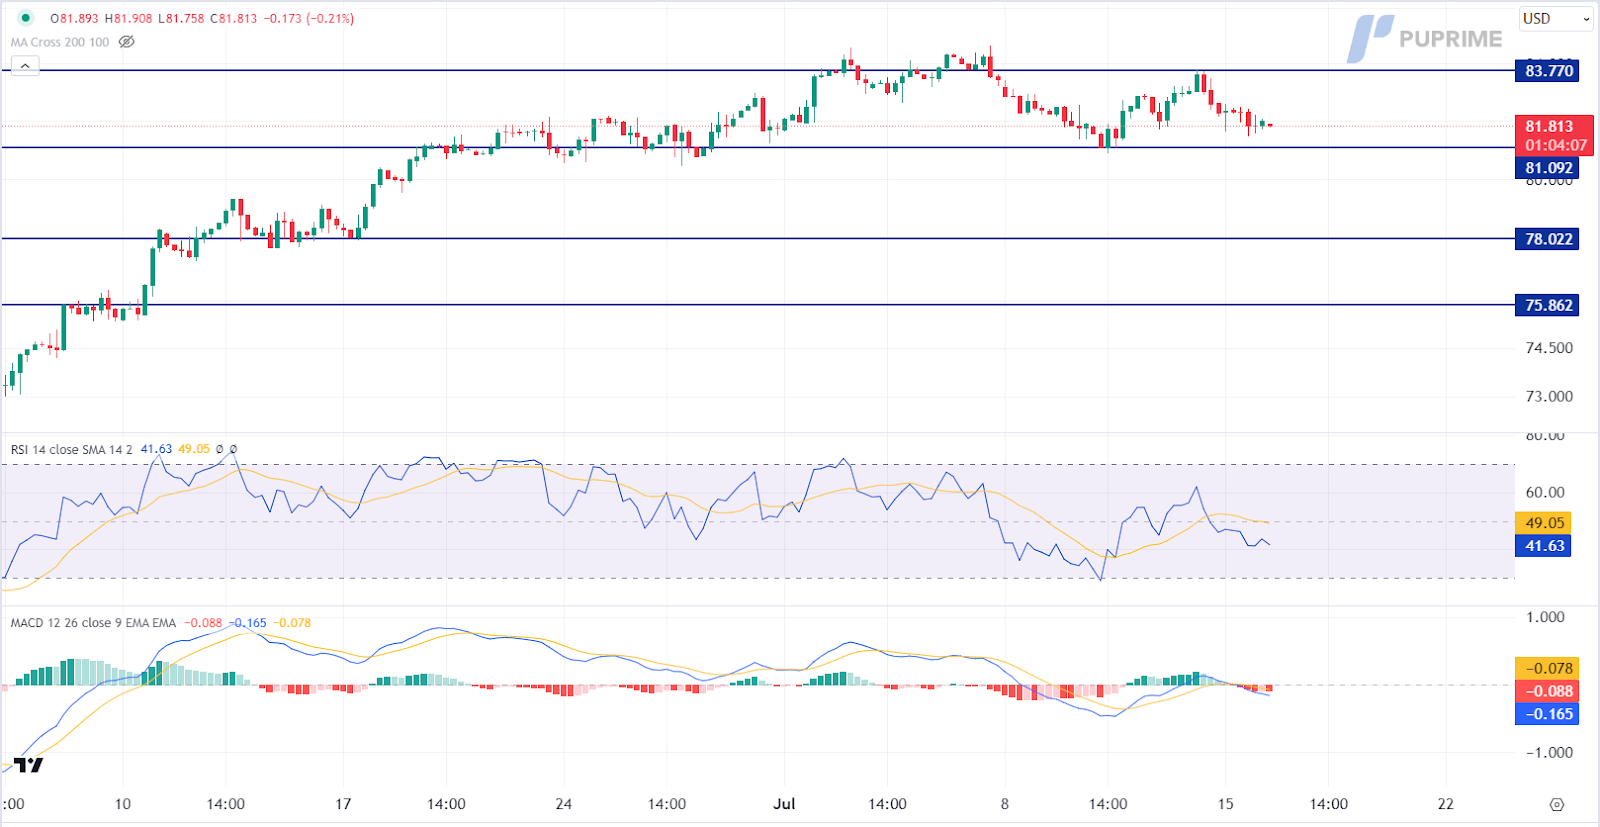
Crude oil prices eased slightly, weighed down by downbeat economic data from China, the top importer. The latest GDP reports indicated that China’s economy grew much slower than expected in the second quarter due to a protracted property downturn and job insecurity. China’s refinery output fell by 3.70% in June from a year earlier, marking the third consecutive month of decline due to planned maintenance and lacklustre fuel demand. Nonetheless, the losses in the oil market are still limited by rising Middle East tensions and OPEC’s efforts to stabilise oil prices.
Oil prices are trading lower following retracement from the resistance level. MACD has illustrated increasing bearish momentum, while RSI is at 42, suggesting the commodity might extend its losses since the RSI stays below the midline.
Resistance level: 83.75, 86.65
Support level: 81.10, 78.00

Trade with simulated capital and earn real profits after you pass our trader assessment.

20 May 2025, 06:46 Gold Slips as Ceasefire Hopes Curb Safe-Haven Demand

7 May 2025, 03:59 Geopolitical Risks and FOMC Uncertainty Shake Global Markets

6 May 2025, 05:53 Dollar Dips, Gold Rallies on U.S.-Taiwan Risk


New Registrations Unavailable
We’re not accepting new registrations at the moment.
While new sign ups are unavailable, existing users can continue their challenges and trading activities as usual.
Disclaimer: This website exclusively provides proprietary trading services. We do not engage in any regulated activities, offer investment management services, or manage funds on behalf of external clients. Our trading activities are conducted solely with the firm's own capital, and we do not accept client deposits or manage client accounts. It's important to note that none of the services we provide should be construed as investment or financial services in accordance with applicable laws.
This website offers services related to professional skill and experience assessment, which determine your eligibility to trade with the firm's capital. The outcome of these services is inherently determined by your individual skill level and ability to perform within the trading requirements and objectives outlined for each service separately. Clients are strongly advised to thoroughly understand the requirements of the services before signing up for any.
The content provided on this website is for informational purposes only and does not constitute financial, investment, or trading advice. The information presented is based on sources believed to be reliable, but we do not guarantee its accuracy, completeness, or timeliness. We disclaim any liability for any loss or damage arising directly or indirectly from the use of or reliance on the information provided on this website.
This website is not directed to residents of certain jurisdictions such as the United States, Singapore, Australia, China and some other specified regions, and is not intended for distribution to, or use by, any person in any countries or jurisdictions where such distribution or use would be contrary to local law or regulation.
This website is owned by Finzero Cap Ltd, a company incorporated in the Republic of Cyprus under registration number HE414308, with its registered office at 62 Athalassas, Mezzanine, Strovolos 2012, Nicosia, Cyprus. Finzero Cap Ltd serves as the authorized representative for PU Prime Ltd.
