Join the PU Xtrader Challenge Today
Trade with simulated capital and earn real profits after you pass our trader assessment.
Join the PU Xtrader Challenge Today
Trade with simulated capital and earn real profits after you pass our trader assessment.
9 April 2024,05:34
Daily Market AnalysisMarket Insights
9 April 2024, 05:34
* Dollar index poised ahead of Wednesday’s CPI reading.
* Gold prices are hovering at all-time high levels while Oil prices are stimulated by tightening supply outlook.
* BTC prices are whisker away from its all-time high at $73630.
Ahead of Wednesday’s critical U.S. Consumer Price Index (CPI) release, U.S. stock markets displayed restraint, while the Dollar Index saw a slight dip. Financial markets have significantly recalibrated their expectations for Federal Reserve rate cuts, now anticipating a mere 60 basis points decrease throughout the year, a dramatic shift from the 150 basis points reduction predicted at the beginning of the year. Meanwhile, yields on U.S. long-term treasuries have climbed to their highest since the previous November, suggesting a possible alignment with the dollar’s trajectory. However, the spotlight is firmly on the imminent CPI announcement for further clarity on inflation trends.
In the commodities realm, gold continues to hover near its all-time highs, and oil prices are nudging towards their zenith since last October. The upward pressure on oil prices is attributed to persistent supply concerns and the volatile geopolitical landscape in the Middle East.
On the international front, the Reserve Bank of New Zealand (RBNZ) is on the cusp of revealing its interest rate verdict tomorrow, April 10th. The general expectation is for the central bank to maintain the official cash rate at 5.50%, setting the RBNZ apart from its global counterparts, which have been leaning towards rate cuts. The forecast of a stable interest rate policy could further amplify the New Zealand dollar’s appeal in international forex markets.
Current rate hike bets on 1st May Fed interest rate decision:
Source: CME Fedwatch Tool
0 bps (85.5%) VS -25 bps (14.5%)

N/A
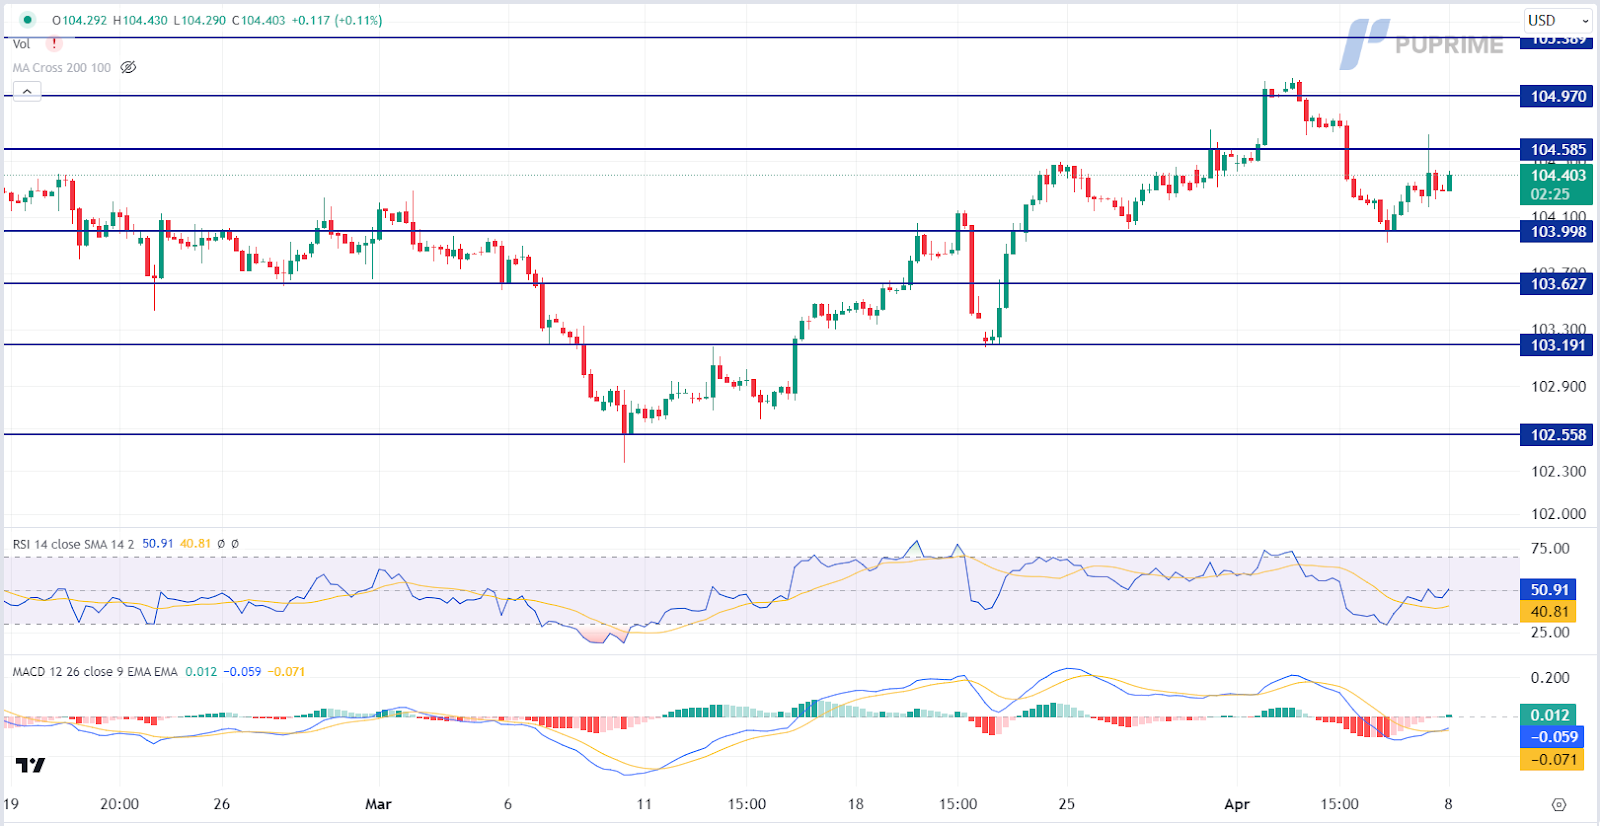
The Dollar Index, which tracks the performance of the US Dollar against a basket of major currencies, experienced a slight retreat as investors awaited the release of upcoming US inflation figures later this week. Despite positive reports on Nonfarm Payrolls and the Unemployment Rate, economists anticipate a potential decline in inflation compared to the previous reading. Projections suggest a 0.30% monthly increase in the headline Consumer Price Index (CPI), down from February’s 0.40%. Heightened market uncertainties prompted some investors to diversify their portfolios, reducing demand for the US Dollar.
Currently, the Dollar Index is trading lower, hovering near the support level. The Moving Average Convergence Divergence (MACD) indicates increasing bearish momentum, while the Relative Strength Index (RSI) is at 40, suggesting that the index might extend its losses as the RSI remains below the midline.
Resistance level: 104.60, 104.95
Support level:104.00, 103.65
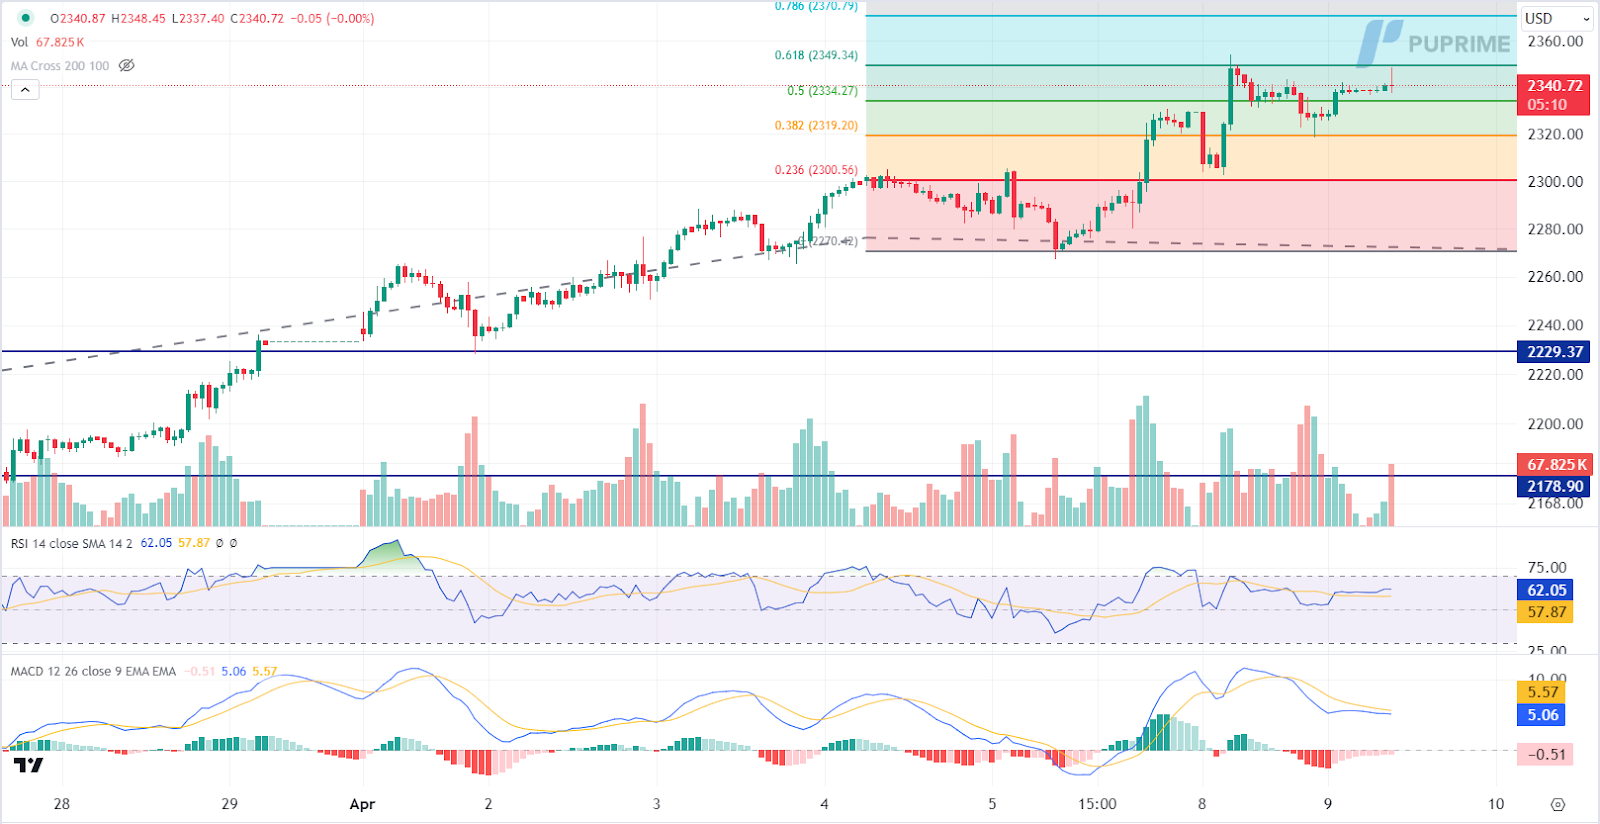
Gold prices demonstrated resilience amidst escalating geopolitical tensions in the Middle East and stalled ceasefire negotiations, maintaining their status as a safe-haven asset amid heightened demand. With geopolitical risks intensifying, market volatility is expected to remain elevated as investors seek refuge in gold. Anticipation of the upcoming US inflation report may further bolster demand for the precious metal, prompting investors to closely monitor developments for additional trading signals amidst ongoing geopolitical uncertainties.
Currently, gold prices are trading higher following a breakout above the previous resistance level. The Moving Average Convergence Divergence (MACD) indicator has shown diminishing bearish momentum, while the Relative Strength Index (RSI) stands at 61, suggesting that the commodity might extend its gains towards the resistance level as the RSI remains above the midline.
Resistance level: 2350.00, 2370.00
Support level: 2335.00, 2320.00
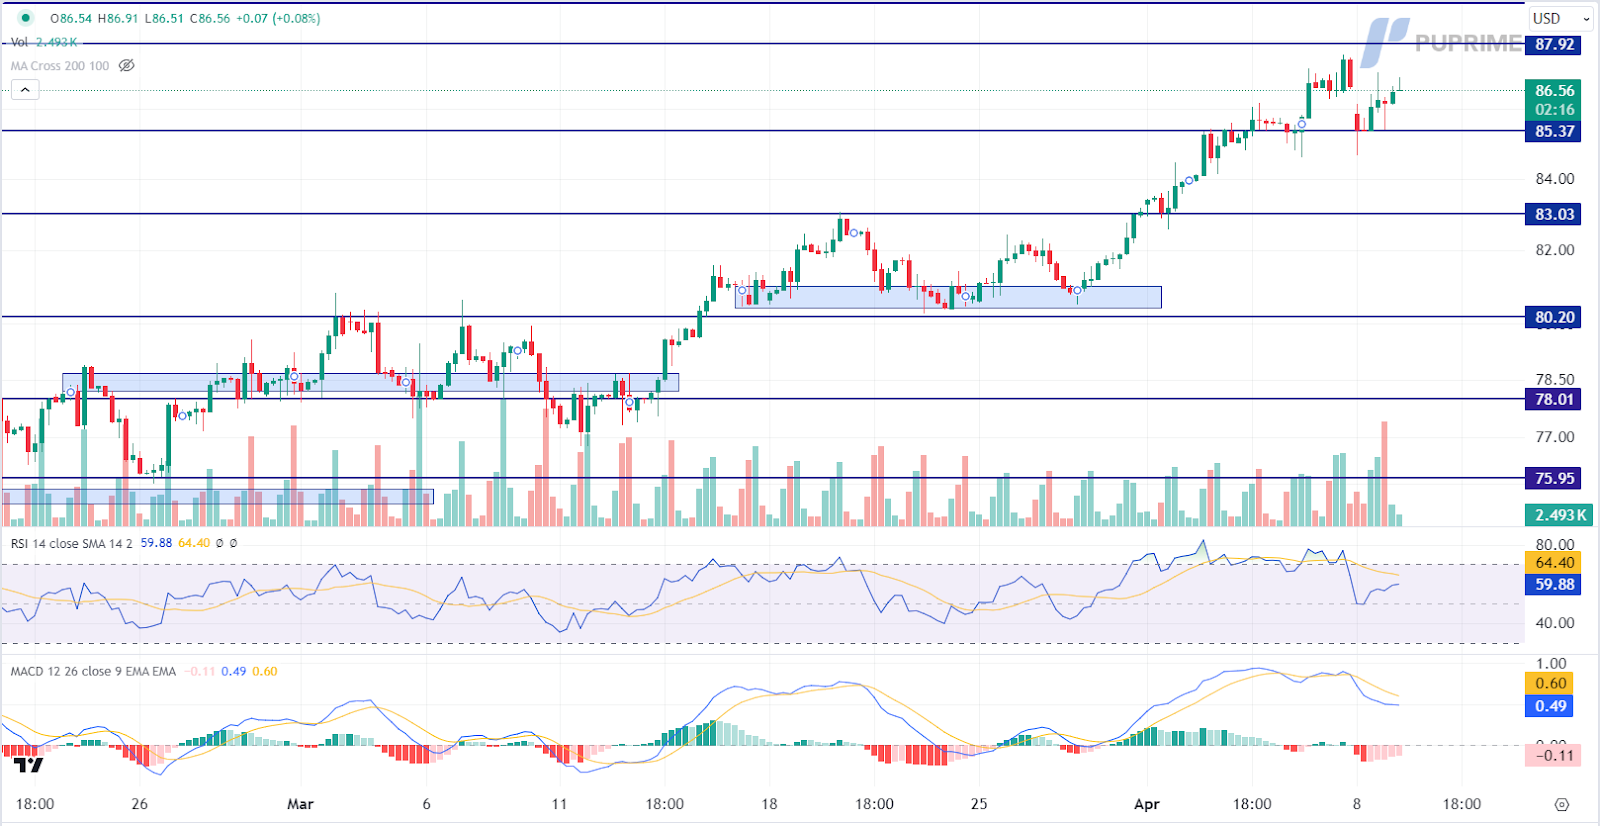
Oil prices continued their upward momentum amidst ongoing fears of supply disruptions in the market. Geopolitical tensions in the Middle East, exacerbated by the failure of ceasefire talks between Israel and Hamas, supported oil prices. Despite efforts by the US and its allies to broker peace, prospects for an immediate resolution appear to be waning, contributing to sustained concerns over supply stability.
Oil prices are trading higher following the prior rebound from the support level. MACD has illustrated diminishing bearish momentum, while RSI is at 60, suggesting the commodity might extend its gains since the RSI stays above the midline.
Resistance level: 87.90, 89.10
Support level: 83.35, 83.05

Trade with simulated capital and earn real profits after you pass our trader assessment.

20 May 2025, 06:46 Gold Slips as Ceasefire Hopes Curb Safe-Haven Demand

7 May 2025, 03:59 Geopolitical Risks and FOMC Uncertainty Shake Global Markets

6 May 2025, 05:53 Dollar Dips, Gold Rallies on U.S.-Taiwan Risk


New Registrations Unavailable
We’re not accepting new registrations at the moment.
While new sign ups are unavailable, existing users can continue their challenges and trading activities as usual.
Disclaimer: This website exclusively provides proprietary trading services. We do not engage in any regulated activities, offer investment management services, or manage funds on behalf of external clients. Our trading activities are conducted solely with the firm's own capital, and we do not accept client deposits or manage client accounts. It's important to note that none of the services we provide should be construed as investment or financial services in accordance with applicable laws.
This website offers services related to professional skill and experience assessment, which determine your eligibility to trade with the firm's capital. The outcome of these services is inherently determined by your individual skill level and ability to perform within the trading requirements and objectives outlined for each service separately. Clients are strongly advised to thoroughly understand the requirements of the services before signing up for any.
The content provided on this website is for informational purposes only and does not constitute financial, investment, or trading advice. The information presented is based on sources believed to be reliable, but we do not guarantee its accuracy, completeness, or timeliness. We disclaim any liability for any loss or damage arising directly or indirectly from the use of or reliance on the information provided on this website.
This website is not directed to residents of certain jurisdictions such as the United States, Singapore, Australia, China and some other specified regions, and is not intended for distribution to, or use by, any person in any countries or jurisdictions where such distribution or use would be contrary to local law or regulation.
This website is owned by Finzero Cap Ltd, a company incorporated in the Republic of Cyprus under registration number HE414308, with its registered office at 62 Athalassas, Mezzanine, Strovolos 2012, Nicosia, Cyprus. Finzero Cap Ltd serves as the authorized representative for PU Prime Ltd.
