Join the PU Xtrader Challenge Today
Trade with simulated capital and earn real profits after you pass our trader assessment.
Join the PU Xtrader Challenge Today
Trade with simulated capital and earn real profits after you pass our trader assessment.
8 April 2024,05:46
Daily Market AnalysisMarket Insights
8 April 2024, 05:46
* Last Friday, NFP came strong, bolstering the U.S. dollar.
* The Japanese wage growth slide led the yen trade to a critical level against the dollar.
* Oil prices decline as the Middle East tension eases.
The U.S. labor market’s vigorous expansion, with the Non-Farm Payroll (NFP) report disclosing an impressive 303,000 job additions that exceeded both previous results and projections, accentuated the U.S. economy’s resilience and amplified concerns over enduring high inflation. Consequently, the Dollar Index (DXY) experienced a resurgence as forecasts about the Federal Reserve’s proclivity for sustaining high-interest rates for a prolonged duration gained traction. This economic buoyancy was mirrored in the U.S. stock market, with all major indexes marking advances at Friday’s close.
Globally, financial markets are now setting their sights on New Zealand, where the Reserve Bank of New Zealand (RBNZ) is slated to make its interest rate decision on Wednesday. The prevailing market sentiment suggests that the RBNZ will hold the official cash rate steady at 5.5%, tempering earlier speculations of a potential rate decrease.
In the realm of commodities, gold reached a new peak before witnessing a pullback amid a reduction in Middle Eastern geopolitical tensions. Meanwhile, the onset of the week saw oil prices dropping more than 1% following news of an Israeli military downsizing in the Gaza Strip, indicating a partial troop withdrawal.
Current rate hike bets on 1st May Fed interest rate decision:
Source: CME Fedwatch Tool
0 bps (85.5%) VS -25 bps (14.5%)

N/A
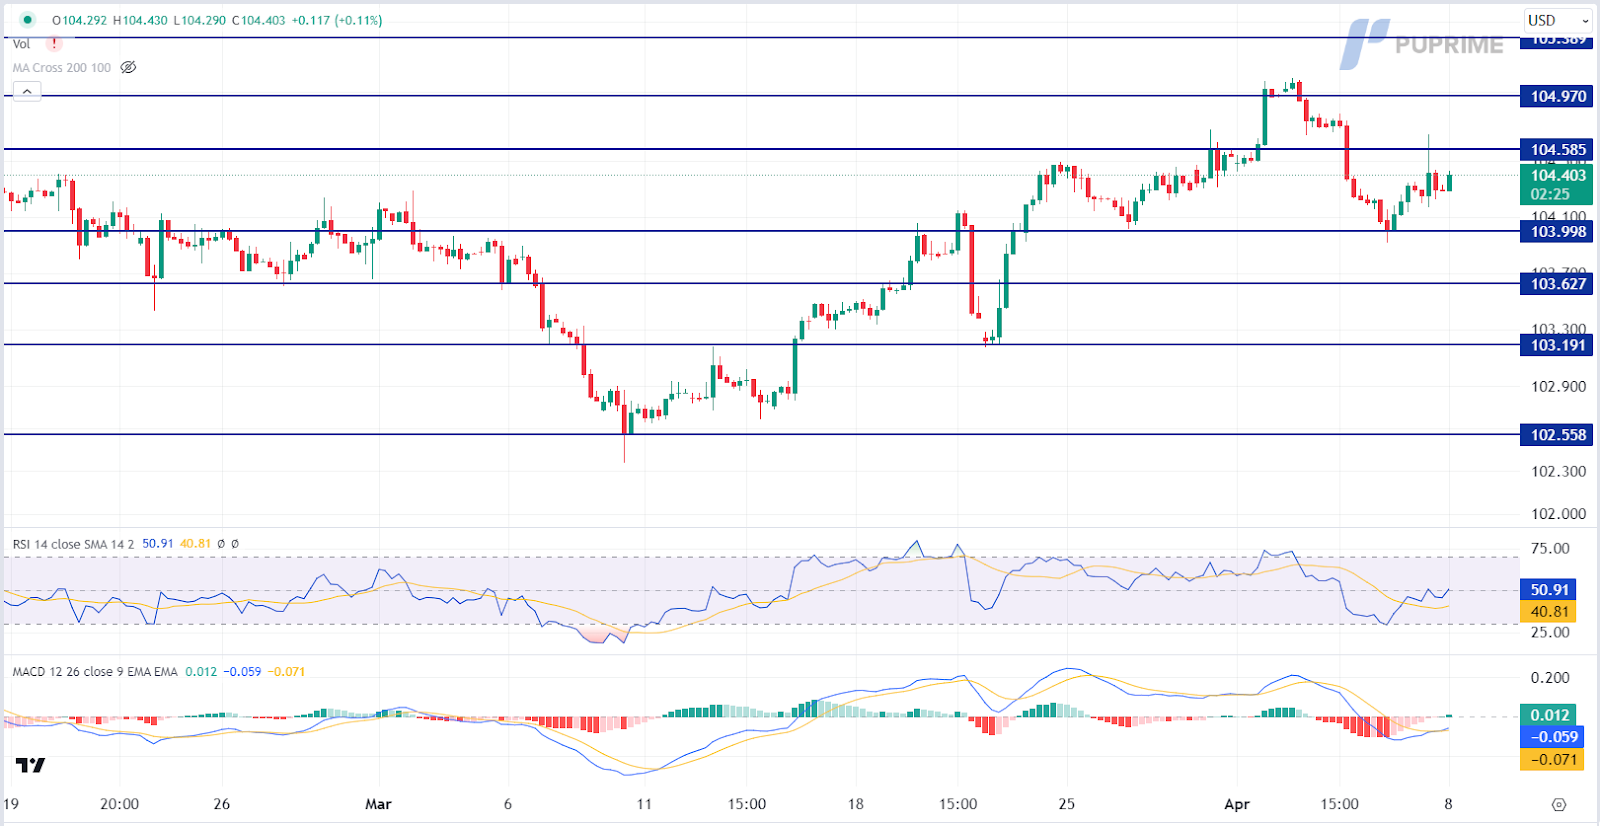
The Dollar Index displayed strong bullish momentum, driven by the impressive US Nonfarm Payrolls report released by the Bureau of Labor Statistics. Nonfarm Payrolls surpassed expectations, surging to 303K from the previous 270K, well above projections of 212K. Simultaneously, the US Unemployment Rate posted a favorable figure of 3.80%, surpassing forecasts of 3.90%. This resulted in a swift shift in market sentiment, with the CME FedWatch Tool indicating reduced expectations of rate cuts in June, plunging to 54.5%. The heightened confidence in the US economy fueled demand for the greenback, further supported by a surge in US Treasury yields.
Currently, the Dollar Index is trading higher after rebounding from the support level. The Moving Average Convergence Divergence (MACD) has demonstrated increasing bullish momentum, while the Relative Strength Index (RSI) is at 51, indicating the possibility of the index extending its gains since the RSI rebounded sharply from oversold territory
Resistance level: 104.60, 104.95
Support level:104.00, 103.65
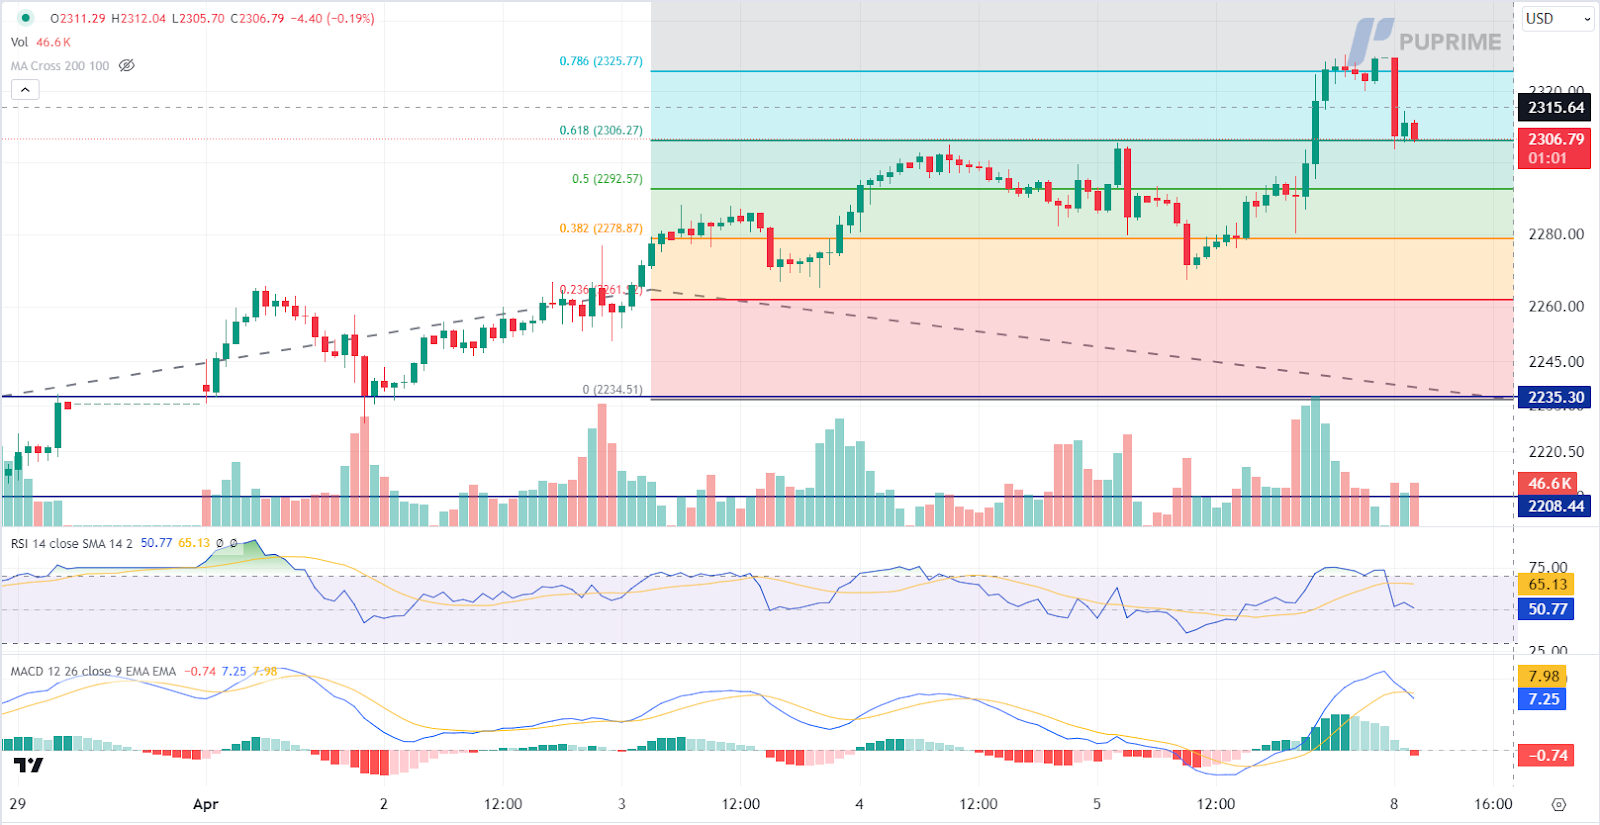
Gold prices witnessed a significant decline as investors redirected their investments towards the US Dollar following the positive jobs report, which diminished expectations of Federal Reserve rate cuts. The strengthened dollar diminished the attractiveness of the precious metal, leading to downward pressure on prices. However, persistent uncertainties prompted some investors to seek shelter in gold, mitigating the losses. The focus now shifts to the upcoming release of March’s consumer price inflation figures, with analysts anticipating a modest decrease in core inflation to 3.70% year-over-year.
Currently, gold prices are trading lower while testing the support level. The Moving Average Convergence Divergence (MACD) has indicated increasing bearish momentum, while the Relative Strength Index (RSI) is at 51, suggesting that the commodity might extend its losses following the breakout since the RSI retreated sharply from overbought territory.
Resistance level: 2325.00, 2350.00
Support level: 230500, 2295.00
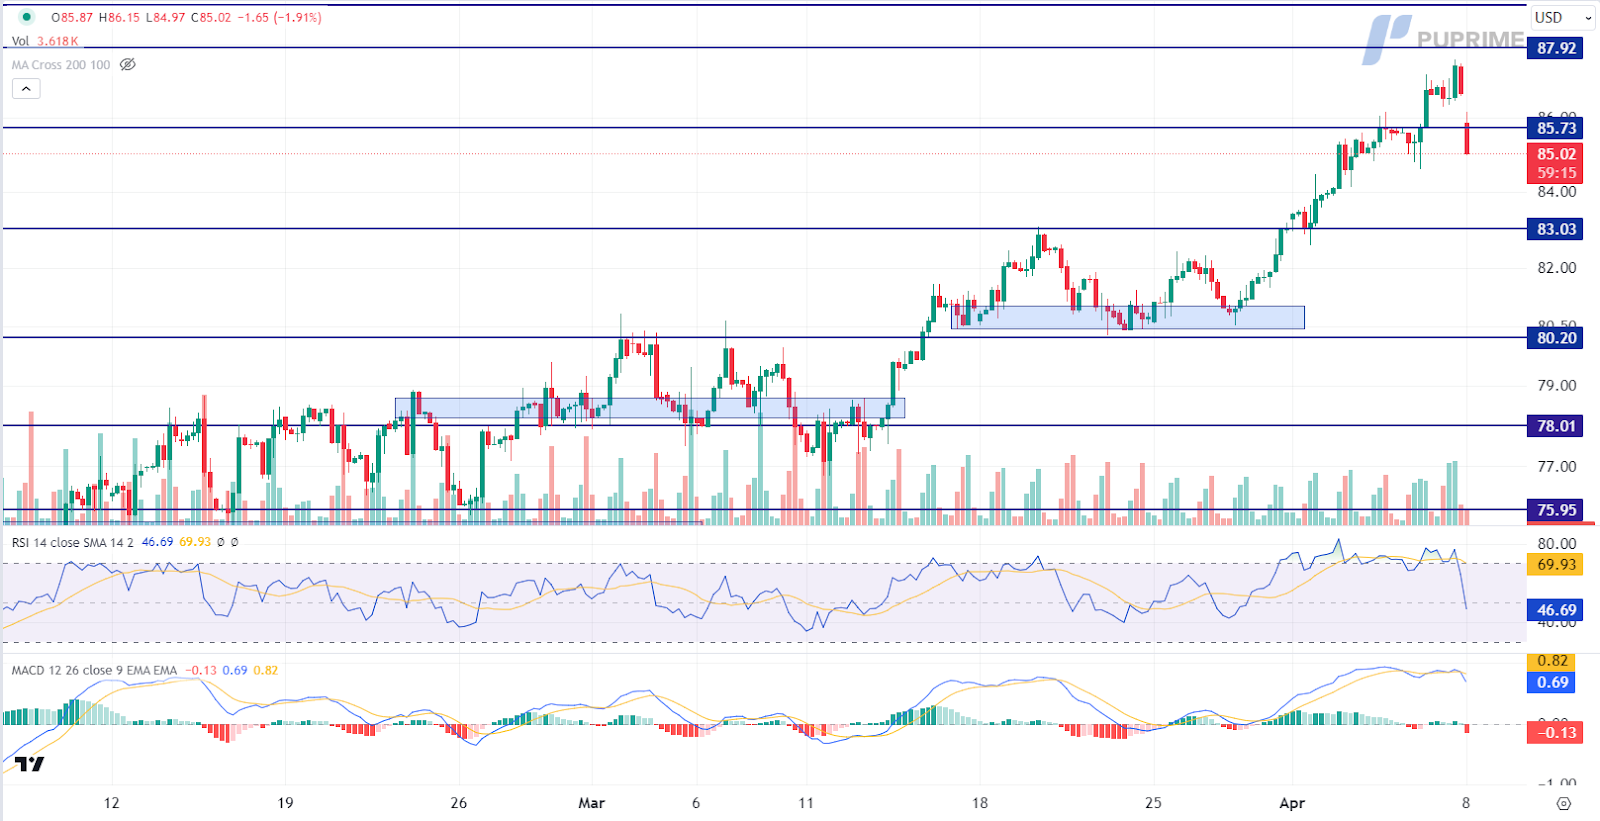
Initially, oil prices surged on the back of heightened geopolitical tensions in the Middle East and concerns over supply constraints, coupled with optimistic demand forecasts. Escalating conflict between Iran and Israel raised apprehensions of potential supply disruptions, bolstering oil prices. However, gains were short-lived as the resurgent US Dollar dampened demand for the dollar-denominated commodity, causing prices to retreat. Market focus remains on geopolitical developments and their impact on global supply dynamics.
Currently, oil prices are trading lower following the retracement from the resistance level. The Moving Average Convergence Divergence (MACD) has indicated increasing bearish momentum, while the Relative Strength Index (RSI) is at 45, suggesting that the commodity might extend its losses since the RSI breakout below the midline.
Resistance level: 85.75, 87.90
Support level: 83.05, 80.20

Trade with simulated capital and earn real profits after you pass our trader assessment.

20 May 2025, 06:46 Gold Slips as Ceasefire Hopes Curb Safe-Haven Demand

7 May 2025, 03:59 Geopolitical Risks and FOMC Uncertainty Shake Global Markets

6 May 2025, 05:53 Dollar Dips, Gold Rallies on U.S.-Taiwan Risk


New Registrations Unavailable
We’re not accepting new registrations at the moment.
While new sign ups are unavailable, existing users can continue their challenges and trading activities as usual.
Disclaimer: This website exclusively provides proprietary trading services. We do not engage in any regulated activities, offer investment management services, or manage funds on behalf of external clients. Our trading activities are conducted solely with the firm's own capital, and we do not accept client deposits or manage client accounts. It's important to note that none of the services we provide should be construed as investment or financial services in accordance with applicable laws.
This website offers services related to professional skill and experience assessment, which determine your eligibility to trade with the firm's capital. The outcome of these services is inherently determined by your individual skill level and ability to perform within the trading requirements and objectives outlined for each service separately. Clients are strongly advised to thoroughly understand the requirements of the services before signing up for any.
The content provided on this website is for informational purposes only and does not constitute financial, investment, or trading advice. The information presented is based on sources believed to be reliable, but we do not guarantee its accuracy, completeness, or timeliness. We disclaim any liability for any loss or damage arising directly or indirectly from the use of or reliance on the information provided on this website.
This website is not directed to residents of certain jurisdictions such as the United States, Singapore, Australia, China and some other specified regions, and is not intended for distribution to, or use by, any person in any countries or jurisdictions where such distribution or use would be contrary to local law or regulation.
This website is owned by Finzero Cap Ltd, a company incorporated in the Republic of Cyprus under registration number HE414308, with its registered office at 62 Athalassas, Mezzanine, Strovolos 2012, Nicosia, Cyprus. Finzero Cap Ltd serves as the authorized representative for PU Prime Ltd.
