Join the PU Xtrader Challenge Today
Trade with simulated capital and earn real profits after you pass our trader assessment.
Join the PU Xtrader Challenge Today
Trade with simulated capital and earn real profits after you pass our trader assessment.
5 April 2024,06:32
Daily Market AnalysisMarket Insights
5 April 2024, 06:32
* The dollar index traded steadily at above the $104 mark ahead of today’s NFP.
* Oil price rally to its highest level since last October as tension escalates in the Middle East.
* BoJ’s Ueda hawkish comment yesterday bolsters the Japanese Yen.
Gold prices have surged past another milestone, firmly holding above the $2300 mark, driven by growing market sentiment favouring a Federal Reserve interest rate cut later this year. Federal Reserve Chair Jerome Powell’s recent speech reinforced this sentiment, emphasising the need for continued assessment of market conditions before considering any reduction in borrowing costs. Despite recent inflationary indicators, the Fed’s plan for a rate cut in 2024 remains intact. Powell’s dovish tone during the speech prompted a 0.5% decline in the dollar during the last session, thereby bolstering gold prices further.
In contrast, the eurozone’s Consumer Price Index (CPI) readings unveiled yesterday fell short of expectations, indicating that the region is still some distance away from achieving its targeted 2% inflation rate. This has weighed on the euro’s strength, with speculations emerging about a potential early rate cut by the European Central Bank (ECB). Traders are eagerly awaiting the release of the ECB monetary policy meeting minutes later today to glean insights into the euro’s trajectory and any potential policy shifts by the ECB.
Current rate hike bets on 1st May Fed interest rate decision:
Source: CME Fedwatch Tool
0 bps (85.5%) VS -25 bps (14.5%)
(MT4 System Time)

Source: MQL5
(MT4 System Time)

Source: MQL5
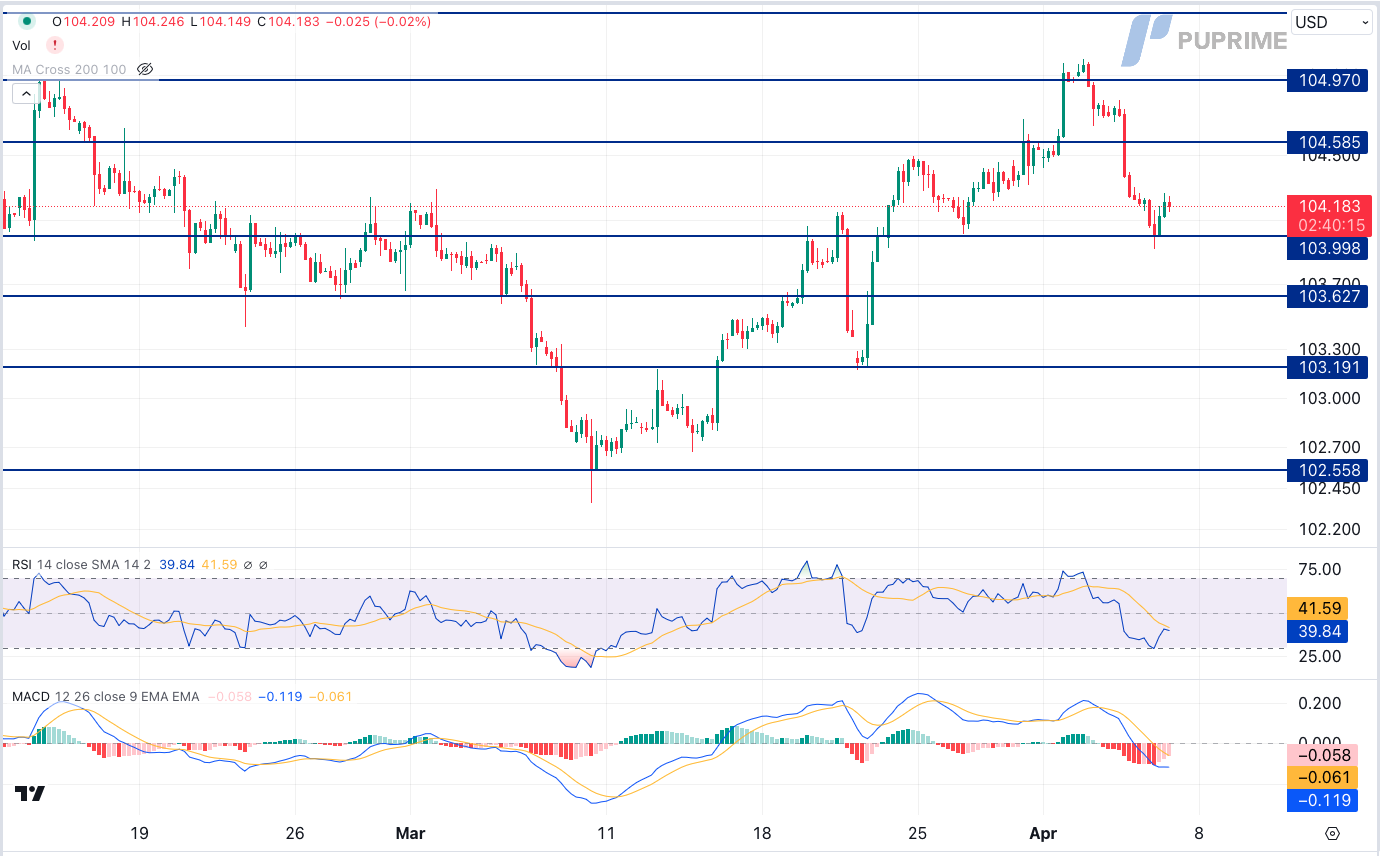
The Dollar Index, a key measure of the greenback’s strength against major currencies, continued its downward trajectory, influenced by a surprising uptick in US Initial Jobless Claims. According to the Department of Labor, Initial Jobless Claims unexpectedly rose from 212K to 221K, falling short of market forecasts. This unexpected development could significantly impact market expectations for forthcoming key economic data releases, including Nonfarm Payrolls and the Unemployment Rate.
Currently, the Dollar Index is trading lower and is approaching the support level. However, despite the bearish momentum, the Moving Average Convergence Divergence (MACD) indicator suggests a decrease in bearish strength, while the Relative Strength Index (RSI) stands at 40, indicating a potential technical correction as the RSI rebounds sharply from oversold territory.
Resistance level: 104.60, 104.95
Support level:104.00, 103.65
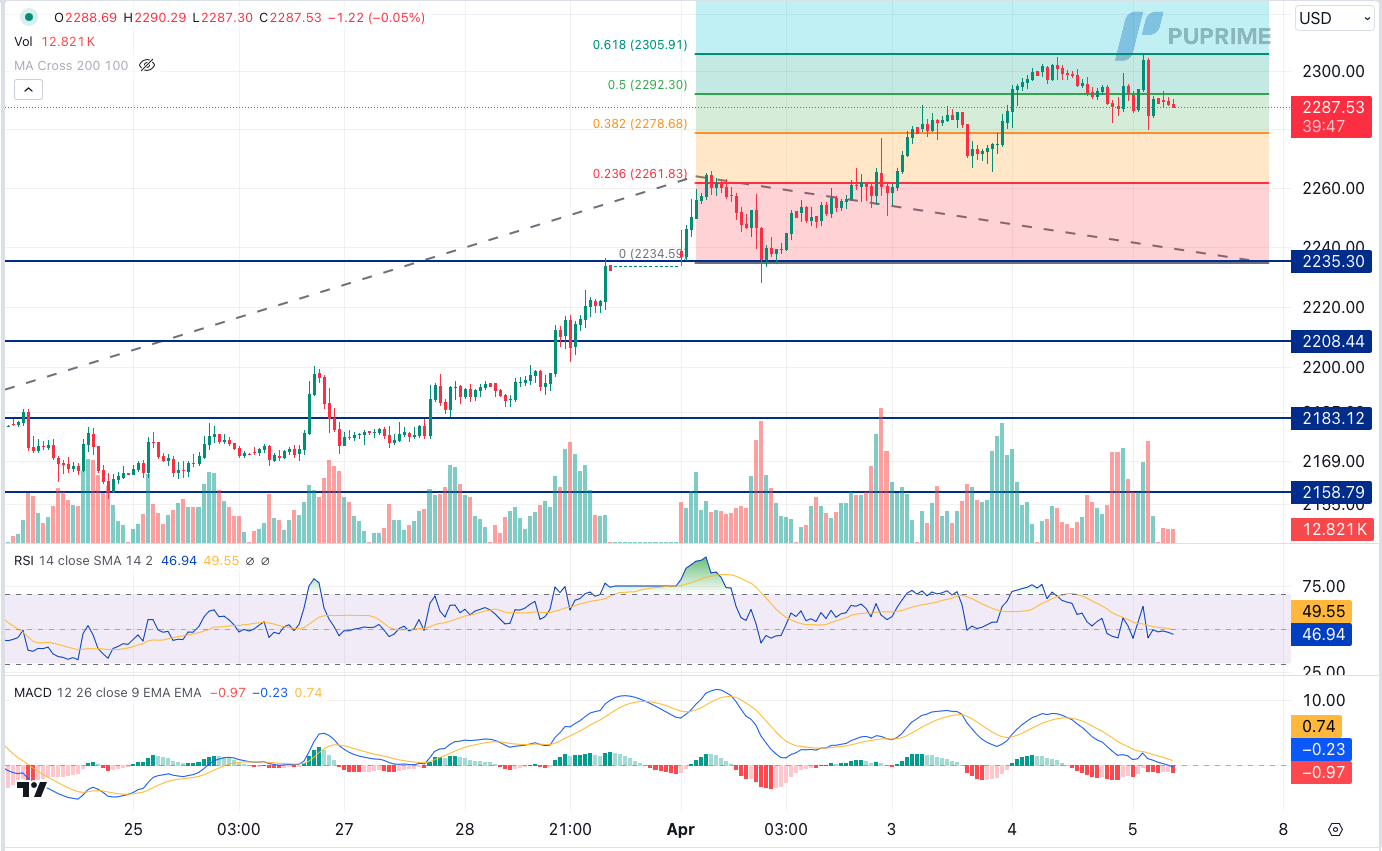
Despite a marginal slowdown in bullish momentum, gold prices remained near historic highs as global investors exercised caution ahead of pivotal economic data releases. Geopolitical tensions in regions such as the Middle East, ongoing crises in Russia and Ukraine, and recent seismic activity in Taiwan continued to fuel safe-haven demand for gold. Furthermore, the weakening US Dollar provided additional support to gold prices.
Currently, gold prices are trading flat and are testing the resistance level. However, the Moving Average Convergence Divergence (MACD) indicator has shown an increase in bearish momentum, while the Relative Strength Index (RSI) stands at 46, suggesting the possibility of downward movement as the RSI remains below the midline
Resistance level: 2290.00, 2305.00
Support level: 2280.00, 2260.00
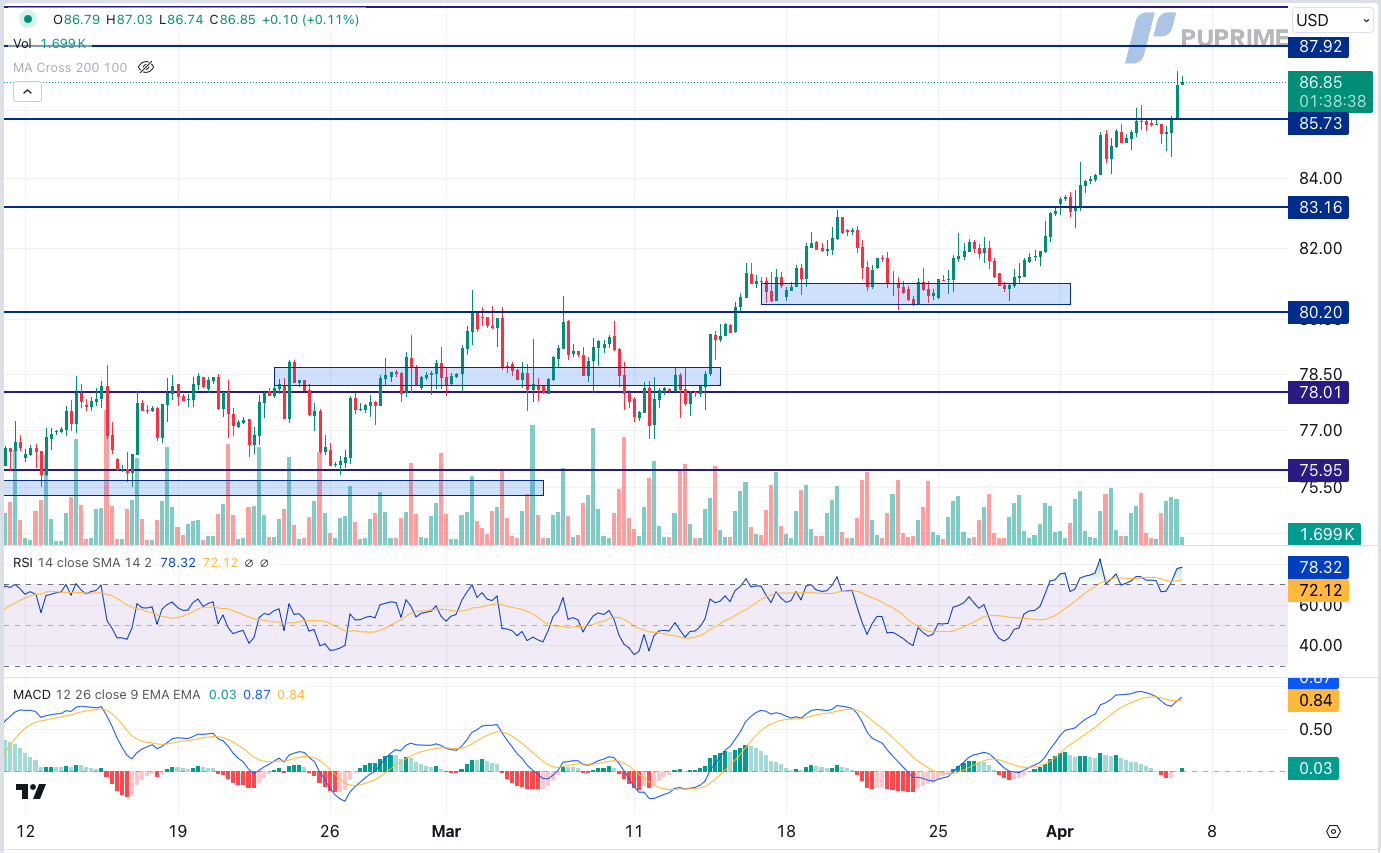
Crude oil prices witnessed a notable surge driven by concerns surrounding diminished supply, as major producers like OPEC+ opted to uphold output cuts. Additionally, growing indications of economic robustness in China contributed to heightened oil demand, highlighting the market’s focus on supply dynamics amid geopolitical tensions and fears of supply disruptions.
Currently, oil prices are trading higher after breaking out above the previous resistance level. The Moving Average Convergence Divergence (MACD) indicator has shown an increase in bullish momentum. However, the Relative Strength Index (RSI) stands at 79, suggesting the possibility of the commodity entering overbought territory
Resistance level: 87.90, 89.10
Support level: 83.75, 83.15

Trade with simulated capital and earn real profits after you pass our trader assessment.

20 May 2025, 06:46 Gold Slips as Ceasefire Hopes Curb Safe-Haven Demand

7 May 2025, 03:59 Geopolitical Risks and FOMC Uncertainty Shake Global Markets

6 May 2025, 05:53 Dollar Dips, Gold Rallies on U.S.-Taiwan Risk


New Registrations Unavailable
We’re not accepting new registrations at the moment.
While new sign ups are unavailable, existing users can continue their challenges and trading activities as usual.
Disclaimer: This website exclusively provides proprietary trading services. We do not engage in any regulated activities, offer investment management services, or manage funds on behalf of external clients. Our trading activities are conducted solely with the firm's own capital, and we do not accept client deposits or manage client accounts. It's important to note that none of the services we provide should be construed as investment or financial services in accordance with applicable laws.
This website offers services related to professional skill and experience assessment, which determine your eligibility to trade with the firm's capital. The outcome of these services is inherently determined by your individual skill level and ability to perform within the trading requirements and objectives outlined for each service separately. Clients are strongly advised to thoroughly understand the requirements of the services before signing up for any.
The content provided on this website is for informational purposes only and does not constitute financial, investment, or trading advice. The information presented is based on sources believed to be reliable, but we do not guarantee its accuracy, completeness, or timeliness. We disclaim any liability for any loss or damage arising directly or indirectly from the use of or reliance on the information provided on this website.
This website is not directed to residents of certain jurisdictions such as the United States, Singapore, Australia, China and some other specified regions, and is not intended for distribution to, or use by, any person in any countries or jurisdictions where such distribution or use would be contrary to local law or regulation.
This website is owned by Finzero Cap Ltd, a company incorporated in the Republic of Cyprus under registration number HE414308, with its registered office at 62 Athalassas, Mezzanine, Strovolos 2012, Nicosia, Cyprus. Finzero Cap Ltd serves as the authorized representative for PU Prime Ltd.
