Join the PU Xtrader Challenge Today
Trade with simulated capital and earn real profits after you pass our trader assessment.
Join the PU Xtrader Challenge Today
Trade with simulated capital and earn real profits after you pass our trader assessment.
25 March 2024,06:19
Daily Market AnalysisMarket Insights
25 March 2024, 06:19
* U.S. inflation gauge saw bolstering Dollar’s strength, and all eyes are on Friday’s U.S. PCE.
* Japanese Yen strengthened on potential Japanese authority intervention as Yen traded to its weakest level.
* Gold prices rebounded amid geopolitical uncertainties in Europe and the Middle East.
As the week begins, market participants are eagerly awaiting the release of the Federal Reserve’s preferred inflation gauge, the PCE index, scheduled for Friday, alongside remarks from Federal Reserve Chair Jerome Powell. The U.S. dollar is currently bolstered by persistent inflationary pressures in the country, prompting analysts to revise downward their expectations for rate cuts in 2024.
In contrast, the Japanese Yen has seen a modest appreciation against the dollar, despite the Bank of Japan’s decision to implement its first rate hike since 2007. Market speculation and warnings from Japanese officials regarding potential currency fluctuations have contributed to the Yen’s resilience, prompting investors to closely monitor any potential intervention by Japanese authorities.
In the commodities market, oil prices have remained relatively stable, with traders closely monitoring developments related to ceasefire talks in Gaza over the weekend and ongoing conflict in Europe. On the other hand, gold prices have found support around the $2160 level, benefitting from heightened geopolitical tensions and a slight easing in the strength of the U.S. dollar.
Current rate hike bets on 1st May Fed interest rate decision:
Source: CME Fedwatch Tool
0 bps (90%) VS -25 bps (10%)
(MT4 System Time)

Source: MQL5
(MT4 System Time)

Source: MQL5
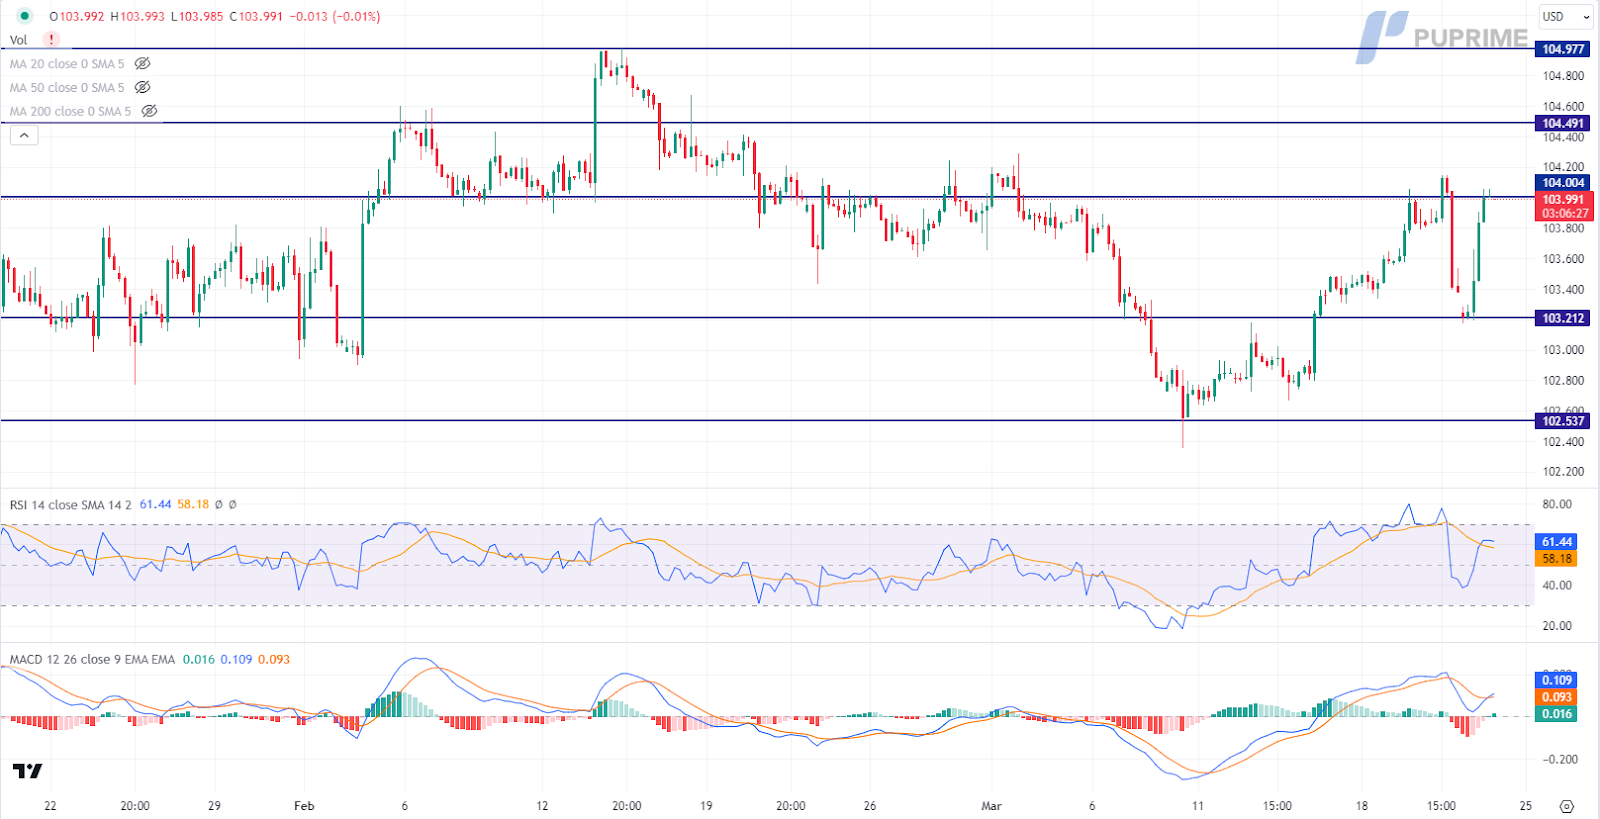
The Dollar Index maintained its upward trend for the second consecutive week, supported by strong economic performance in the US and increasing expectations of interest rate hikes. The widening yield gap between the US Dollar and other major currencies remained a key factor driving the dollar’s strength. Additionally, the Federal Reserve’s optimistic revisions to US economic growth forecasts instilled confidence in investors, bolstering positive sentiment toward the US economic outlook.
Currently, the Dollar Index is trading higher and approaching the resistance level. However, there are indications of diminishing bullish momentum according to the MACD indicator, while the RSI stands at 69, suggesting a potential entry into overbought territory.
Resistance level: 104.45, 104.95
Support level:104.00, 103.65
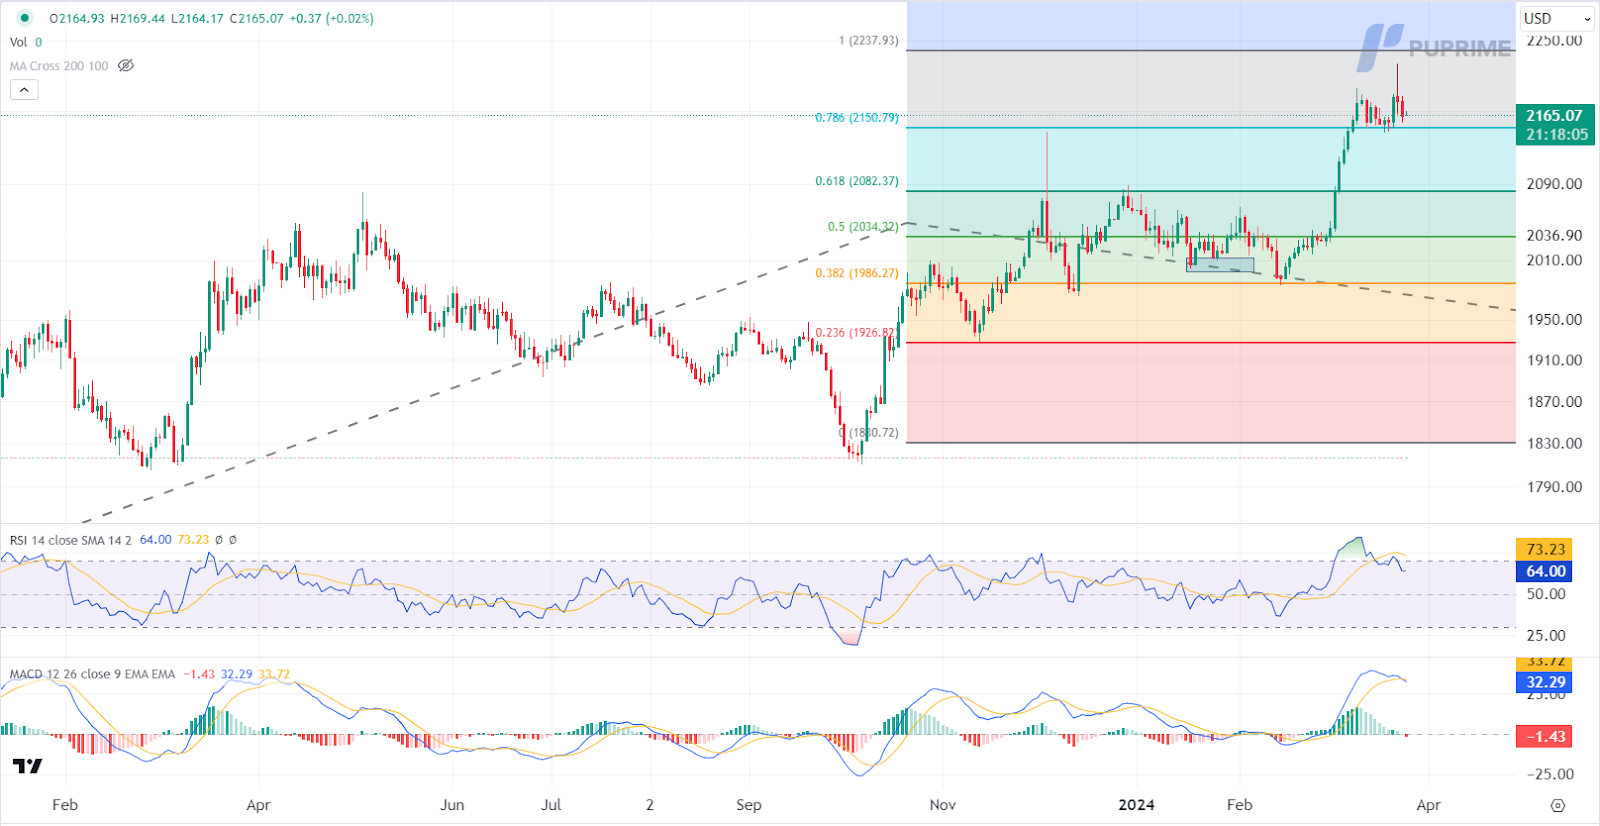
Gold prices faced downward pressure as the resilient US Dollar continued to diminish the attractiveness of non-yielding assets like gold. The Dollar’s strength was further accentuated by indications from major central banks, including the Swiss National Bank, suggesting potential rate cuts in 2024. Despite some dovish sentiments expressed by certain Federal Reserve members regarding rate cuts, the recent robust performance of the US economy adds uncertainty to the outlook for gold prices.
Currently, gold prices are trading lower and testing the support level. The MACD indicator indicates increasing bearish momentum, while the RSI stands at 64, suggesting the possibility of a technical correction following a sharp retreat from overbought territory.
Resistance level: 2240.00, 2315.00
Support level: 2150.00, 2080.00
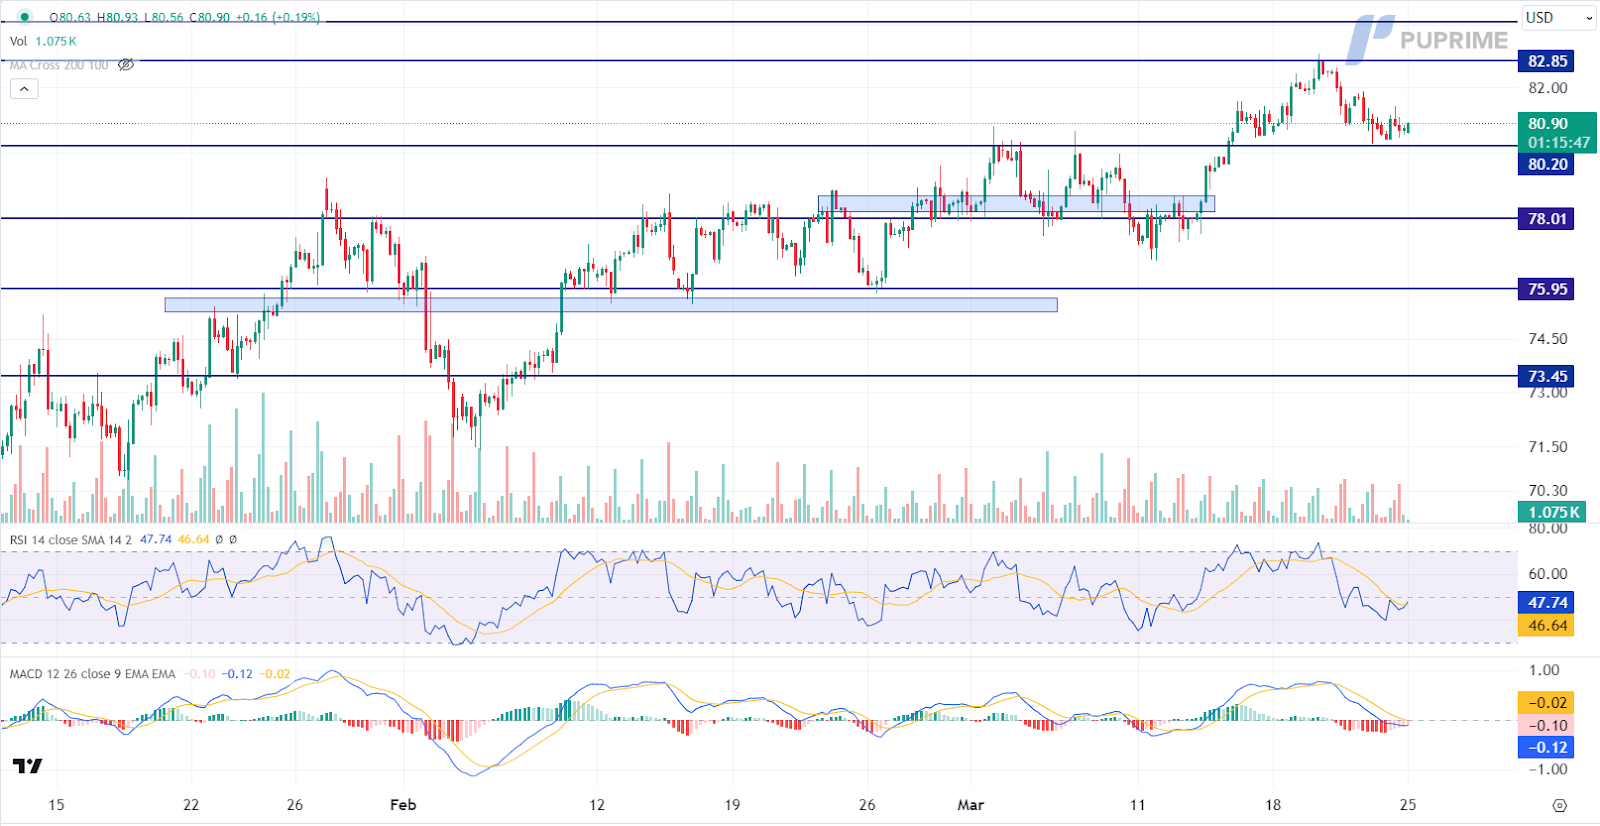
Crude oil prices experienced a modest decline amid growing optimism regarding potential ceasefire negotiations in the Middle East. Comments from US Secretary of State Antony Blinken indicating progress in talks held in Qatar aimed at reaching a ceasefire agreement for the region helped alleviate concerns over oil supply disruptions. This positive development, combined with expectations of reduced geopolitical tensions, contributed to a sense of relief in the oil market.
Currently, oil prices are trading lower and testing the support level. However, there are signs of diminishing bearish momentum according to the MACD indicator, while the RSI stands at 48, suggesting the possibility of technical corrections as the RSI rebounded sharply from oversold territory.
Resistance level: 82.85, 84.10
Support level: 80.20, 78.00

Trade with simulated capital and earn real profits after you pass our trader assessment.

20 May 2025, 06:46 Gold Slips as Ceasefire Hopes Curb Safe-Haven Demand

7 May 2025, 03:59 Geopolitical Risks and FOMC Uncertainty Shake Global Markets

6 May 2025, 05:53 Dollar Dips, Gold Rallies on U.S.-Taiwan Risk


New Registrations Unavailable
We’re not accepting new registrations at the moment.
While new sign ups are unavailable, existing users can continue their challenges and trading activities as usual.
Disclaimer: This website exclusively provides proprietary trading services. We do not engage in any regulated activities, offer investment management services, or manage funds on behalf of external clients. Our trading activities are conducted solely with the firm's own capital, and we do not accept client deposits or manage client accounts. It's important to note that none of the services we provide should be construed as investment or financial services in accordance with applicable laws.
This website offers services related to professional skill and experience assessment, which determine your eligibility to trade with the firm's capital. The outcome of these services is inherently determined by your individual skill level and ability to perform within the trading requirements and objectives outlined for each service separately. Clients are strongly advised to thoroughly understand the requirements of the services before signing up for any.
The content provided on this website is for informational purposes only and does not constitute financial, investment, or trading advice. The information presented is based on sources believed to be reliable, but we do not guarantee its accuracy, completeness, or timeliness. We disclaim any liability for any loss or damage arising directly or indirectly from the use of or reliance on the information provided on this website.
This website is not directed to residents of certain jurisdictions such as the United States, Singapore, Australia, China and some other specified regions, and is not intended for distribution to, or use by, any person in any countries or jurisdictions where such distribution or use would be contrary to local law or regulation.
This website is owned by Finzero Cap Ltd, a company incorporated in the Republic of Cyprus under registration number HE414308, with its registered office at 62 Athalassas, Mezzanine, Strovolos 2012, Nicosia, Cyprus. Finzero Cap Ltd serves as the authorized representative for PU Prime Ltd.
