Join the PU Xtrader Challenge Today
Trade with simulated capital and earn real profits after you pass our trader assessment.
Join the PU Xtrader Challenge Today
Trade with simulated capital and earn real profits after you pass our trader assessment.
22 March 2024,05:58
Daily Market AnalysisMarket Insights
22 March 2024, 05:58
* Robust U.S. job data and PMI readings bolster the dollar to rebound.
* Dovish Expectations on BoE exerted pressure on the Pound Sterling.
* Gold prices eased by more than 1% amid the dollar strengthening.
Yesterday saw a notable rally in the dollar index (DXY), reversing the losses from the previous session and positioning the dollar to surpass its previous resistance level at $104.15. This resurgence was supported by positive economic indicators, including strong job market data and PMI figures that surpassed expectations. The sustained strength of the U.S. economy may prompt the Federal Reserve to reconsider its planned rate reduction strategy for 2024.
Meanwhile, the Bank of England (BoE) adhered to market expectations by maintaining its current interest rate stance. However, with the UK’s CPI decelerating more than anticipated, the central bank appears inclined towards a more dovish approach to monetary policy. This shift was underscored by a pivot towards dovishness from two previously hawkish officials.
The recalibration of expectations surrounding the Fed’s monetary policy has bolstered the dollar significantly. However, this strength in the dollar has exerted notable pressure on commodity markets. Gold prices retreated by nearly 1.50%, while oil prices experienced three consecutive days of declines, directly influenced by the robust performance of the dollar.
Current rate hike bets on 20th March Fed interest rate decision:
Source: CME Fedwatch Tool
0 bps (95%) VS -25 bps (5%)
(MT4 System Time)

Source: MQL5
(MT4 System Time)

Source: MQL5
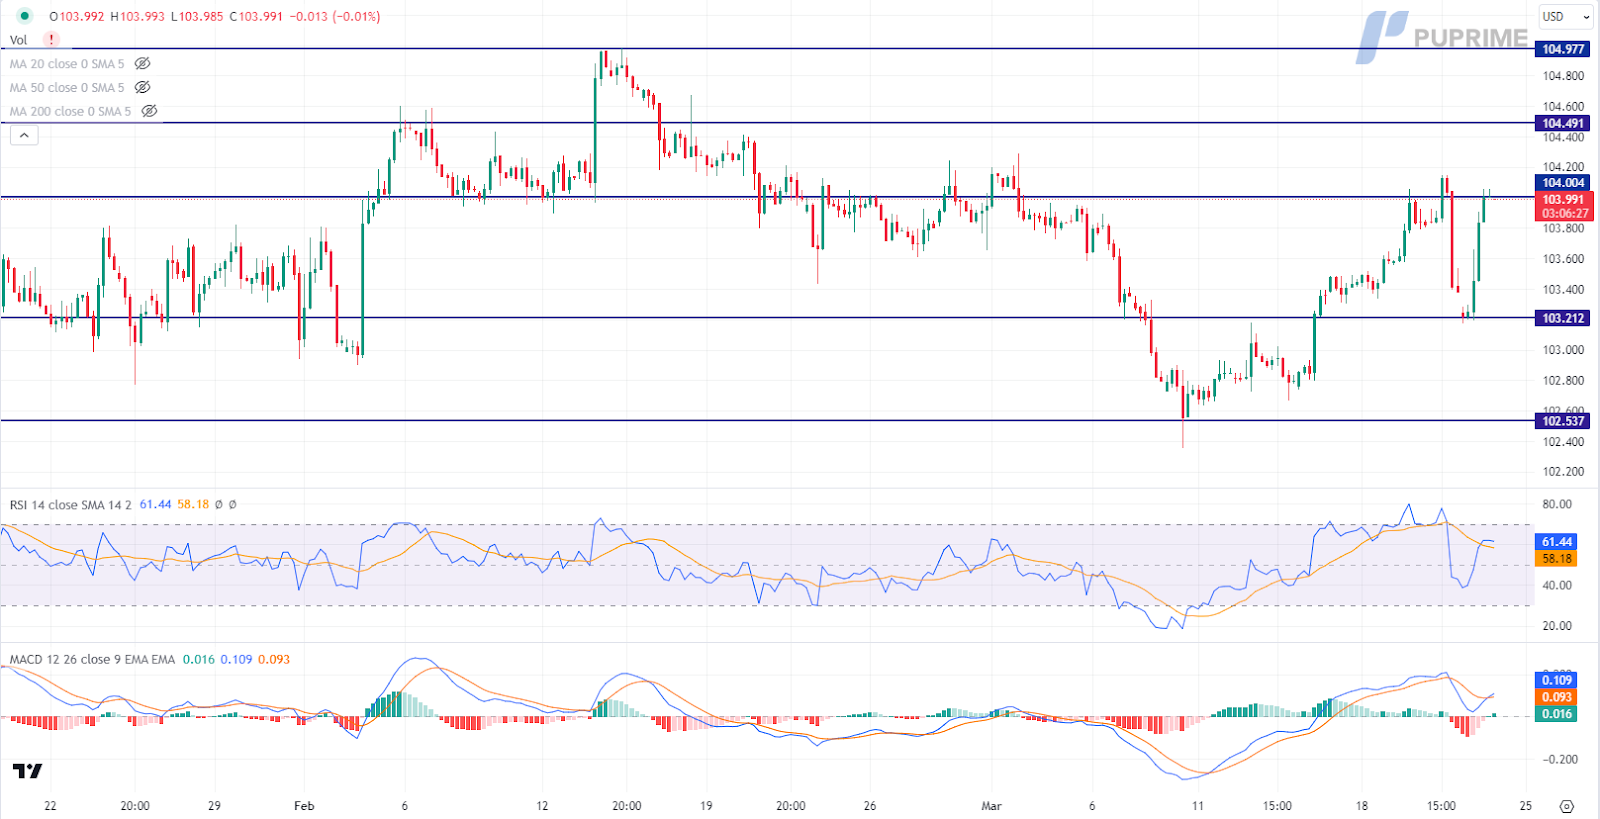
The Dollar Index, which tracks the greenback against a basket of major currencies, surged following the release of better-than-expected US economic data, boosting confidence in the Federal Reserve’s positive outlook. With US Initial Jobless Claims declining to 210,000, surpassing expectations, and Fed Chair Jerome Powell reaffirming the strength of the labor market, investor sentiment leaned towards the US Dollar. Additionally, rising US Treasury bond yields further bolstered the Dollar’s upward trajectory, signaling increased market confidence in the US economic outlook.
Currently, the Dollar Index is trading higher and testing the resistance level. The MACD indicator has shown increasing bullish momentum, while the RSI stands at 62, indicating that the index may extend its gains after the breakout, particularly since the RSI remains above the midline.
Resistance level: 104.00, 104.50
Support level: 103.20, 102.55
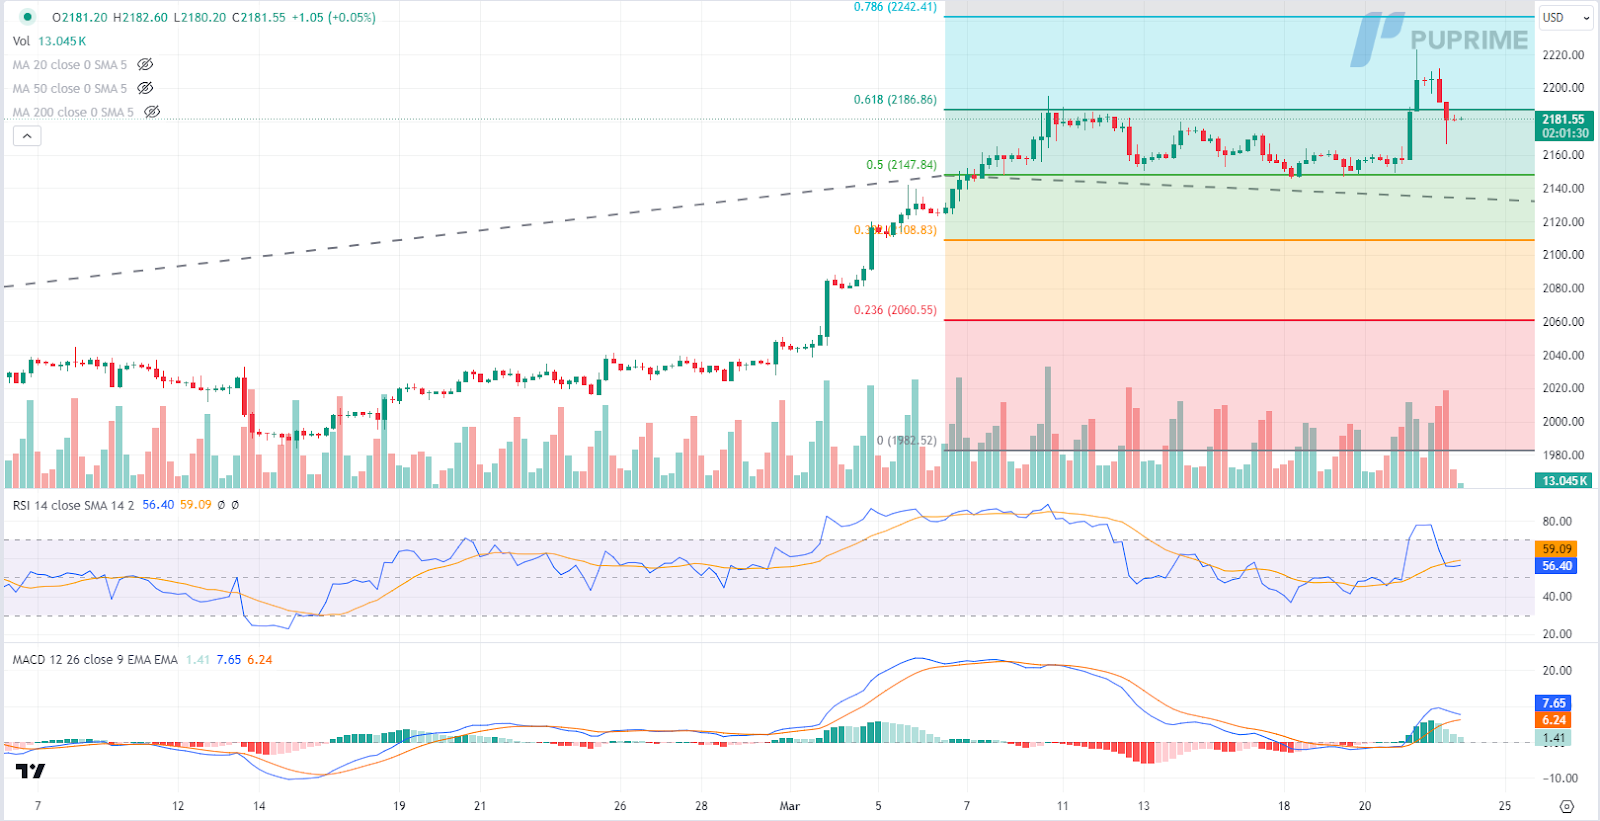
Gold prices retreated from record highs as the US Dollar and US Treasury yields surged, driven by positive economic data releases and the Federal Reserve’s optimistic outlook. Despite the Fed’s upward revisions for GDP and the Core Personal Consumption Expenditure Price Index (PCE) for 2024, which bolstered the US Dollar, gold’s decline was cushioned by ongoing geopolitical tensions and persistent safe-haven demand.
Currently, gold prices are trading lower following the prior retracement from the resistance level. The MACD indicator has shown diminishing bullish momentum, while the RSI stands at 56, suggesting that the commodity may extend its losses, particularly since the RSI has retreated sharply from overbought territory.
Resistance level: 2240.00, 2315.00
Support level: 2185.00, 2150.00
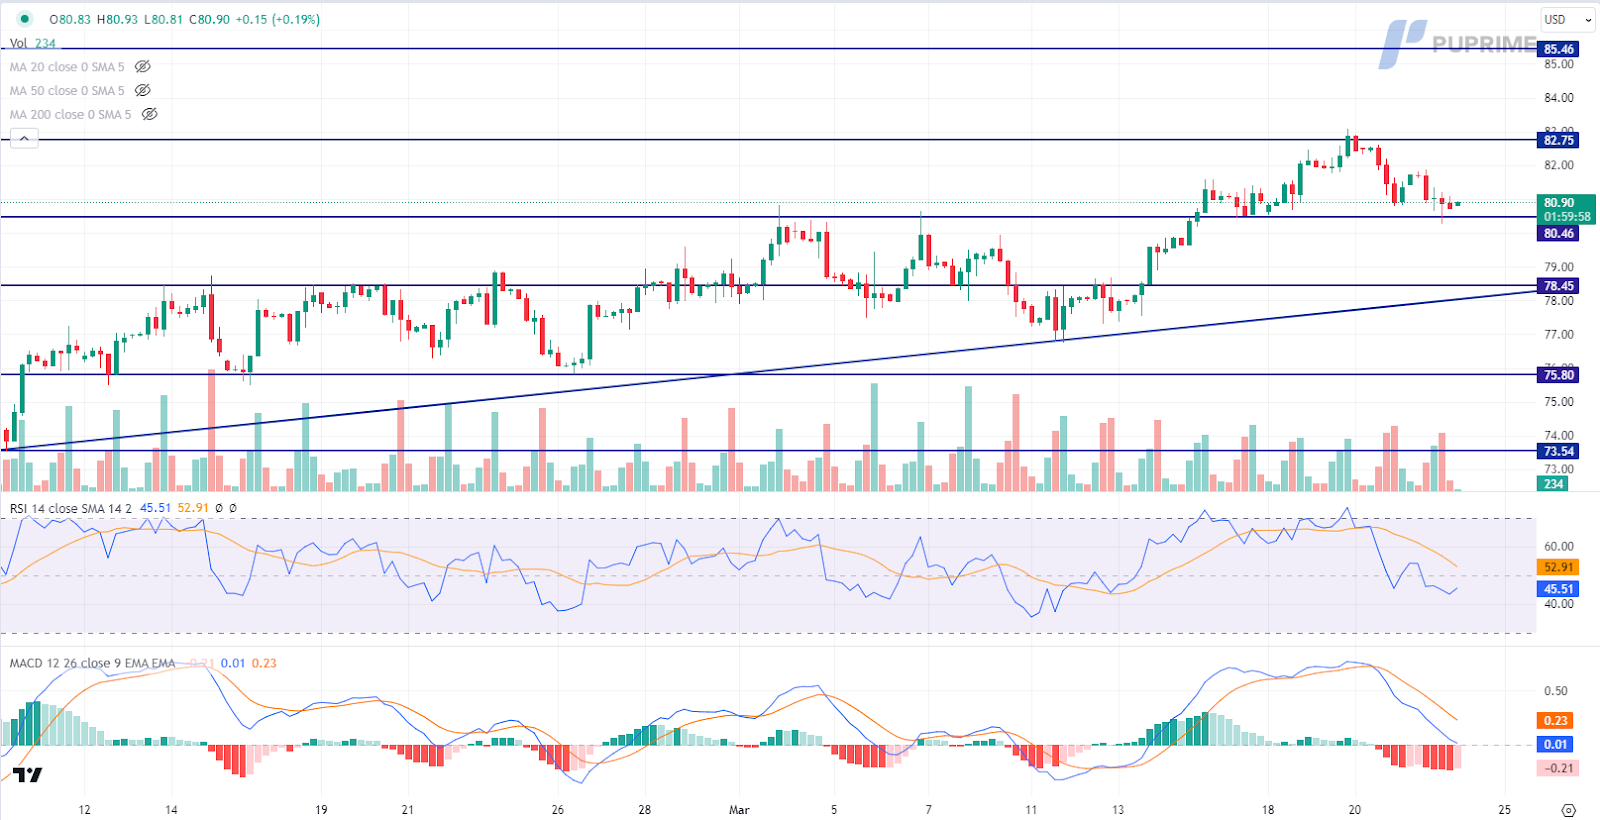
Crude oil prices encountered downward pressure amidst weaker US gasoline demand data and reports of a United Nations draft resolution advocating for a ceasefire in Gaza. The latter development alleviated concerns regarding potential supply disruptions. Despite an unexpected decline in US crude inventories reported by the Energy Information Administration (EIA), gasoline product demand dipped below 9 million barrels, contributing to the prevailing bearish sentiment in the oil market. Geopolitical tensions further weighed on oil prices, as the US initiated a UN resolution aimed at facilitating a ceasefire, thereby tempering market apprehensions.
Currently, oil prices are trading lower while testing the support level. The MACD indicator has displayed increasing bearish momentum, while the RSI stands at 45, suggesting that the commodity may extend its losses, particularly since the RSI remains below the midline.
Resistance level: 82.75, 85.45
Support level: 80.45, 78.45

Trade with simulated capital and earn real profits after you pass our trader assessment.

20 May 2025, 06:46 Gold Slips as Ceasefire Hopes Curb Safe-Haven Demand

7 May 2025, 03:59 Geopolitical Risks and FOMC Uncertainty Shake Global Markets

6 May 2025, 05:53 Dollar Dips, Gold Rallies on U.S.-Taiwan Risk


New Registrations Unavailable
We’re not accepting new registrations at the moment.
While new sign ups are unavailable, existing users can continue their challenges and trading activities as usual.
Disclaimer: This website exclusively provides proprietary trading services. We do not engage in any regulated activities, offer investment management services, or manage funds on behalf of external clients. Our trading activities are conducted solely with the firm's own capital, and we do not accept client deposits or manage client accounts. It's important to note that none of the services we provide should be construed as investment or financial services in accordance with applicable laws.
This website offers services related to professional skill and experience assessment, which determine your eligibility to trade with the firm's capital. The outcome of these services is inherently determined by your individual skill level and ability to perform within the trading requirements and objectives outlined for each service separately. Clients are strongly advised to thoroughly understand the requirements of the services before signing up for any.
The content provided on this website is for informational purposes only and does not constitute financial, investment, or trading advice. The information presented is based on sources believed to be reliable, but we do not guarantee its accuracy, completeness, or timeliness. We disclaim any liability for any loss or damage arising directly or indirectly from the use of or reliance on the information provided on this website.
This website is not directed to residents of certain jurisdictions such as the United States, Singapore, Australia, China and some other specified regions, and is not intended for distribution to, or use by, any person in any countries or jurisdictions where such distribution or use would be contrary to local law or regulation.
This website is owned by Finzero Cap Ltd, a company incorporated in the Republic of Cyprus under registration number HE414308, with its registered office at 62 Athalassas, Mezzanine, Strovolos 2012, Nicosia, Cyprus. Finzero Cap Ltd serves as the authorized representative for PU Prime Ltd.
