Join the PU Xtrader Challenge Today
Trade with simulated capital and earn real profits after you pass our trader assessment.
Join the PU Xtrader Challenge Today
Trade with simulated capital and earn real profits after you pass our trader assessment.
20 February 2024,06:07
Daily Market AnalysisMarket Insights
20 February 2024, 06:07
* Oil prices remain at a 3-month high as the Red Sea tension continues to simmer.
* The dollar index steady before the FOMC meeting minutes is due on Wednesday.
*Wednesday’s Nvidia earnings reports may catalyse the U.S. equity markets to pick a direction.
China has implemented its most substantial reduction on record to the five-year loan prime rate, signalling a proactive measure to invigorate its economy. Despite this stimulus announcement, equity markets, including the Hang Seng, have exhibited a tepid response.
In the U.S. financial landscape, the forthcoming Nvidia earnings report on Wednesday assumes paramount importance. The outcome of this report holds significance in gauging the vitality of the technology sector, considering Nvidia’s prominence as a leading player in the chip industry. Concurrently, the dollar index remains relatively stable as market participants eagerly await the release of the Federal Open Market Committee (FOMC) meeting minutes scheduled for Wednesday. Recent economic indicators from the United States reflect a robust economic performance, potentially influencing the Federal Reserve to uphold higher interest rates for an extended duration.
Turning attention to Australia, the recently disclosed Reserve Bank of Australia’s (RBA) monetary meeting minutes disclosed contemplations of a potential interest rate hike. However, a judicious and cautious approach was favoured, underscoring the necessity for additional time to assess the trajectory of inflation. Despite this unexpectedly hawkish sentiment, the Australian dollar failed to register significant upward movement.
Current rate hike bets on 20th March Fed interest rate decision:
Source: CME Fedwatch Tool
0 bps (92%) VS -25 bps (8%)
(MT4 System Time)
N/A
Source: MQL5

The US Dollar maintained stability amid a subdued market atmosphere due to US holidays, with investors eagerly awaiting insights from the upcoming FOMC meeting minutes. Despite the robust economic indicators instilling confidence in the US economic trajectory, a pre-FOMC meeting profit-taking trend triggered a modest retracement in the Dollar. Forecasts for aggressive rate cuts by the Federal Reserve have markedly diminished, currently standing at approximately 90 basis points for the year—a substantial reduction from earlier projections in February.
The Dollar Index is exhibiting a neutral trend, currently hovering near a resistance level. The MACD indicator has depicted a waning bearish momentum, while the RSI sits at 50, suggesting the potential for an upward movement post-breakout, particularly as the RSI sharply rebounded from oversold territory.
Resistance level: 104.60, 105.70
Support level: 103.80, 103.00
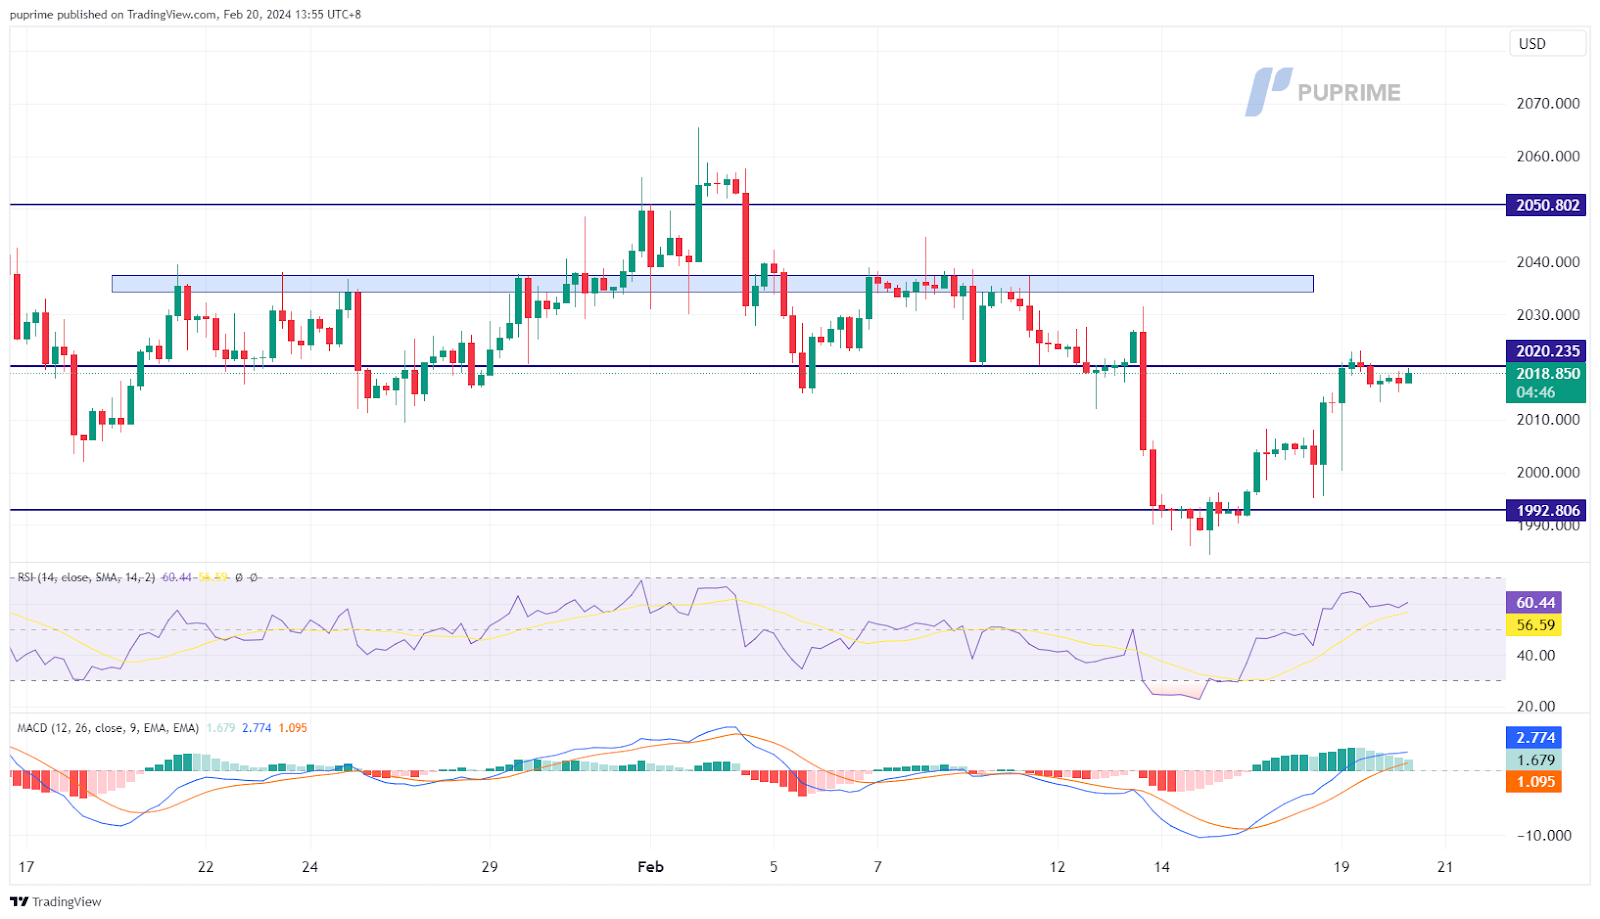
Gold prices demonstrated a muted performance in the lead-up to the imminent release of the FOMC meeting minutes. Against a backdrop of robust economic indicators emanating from the US, prevailing market sentiment leans toward the anticipation of a potentially hawkish stance from the Federal Reserve. This expectation has direct implications for the US Dollar, which is strengthening and, in turn, exerting downward pressure on dollar-denominated gold. Despite these prevailing headwinds, the precious metal retains an inherent upward potential, buoyed by persistent uncertainties in the Middle East, enhancing its role as a safe-haven asset.
Gold prices are maintaining a neutral stance, testing a crucial support level. The MACD has indicated diminishing bullish momentum, while the RSI stands at 56, implying the likelihood of the commodity trading lower post-breakout, particularly as the RSI maintains a position below the midline.
Resistance level: 2035.00, 2060.00
Support level: 2015.00, 1985.00
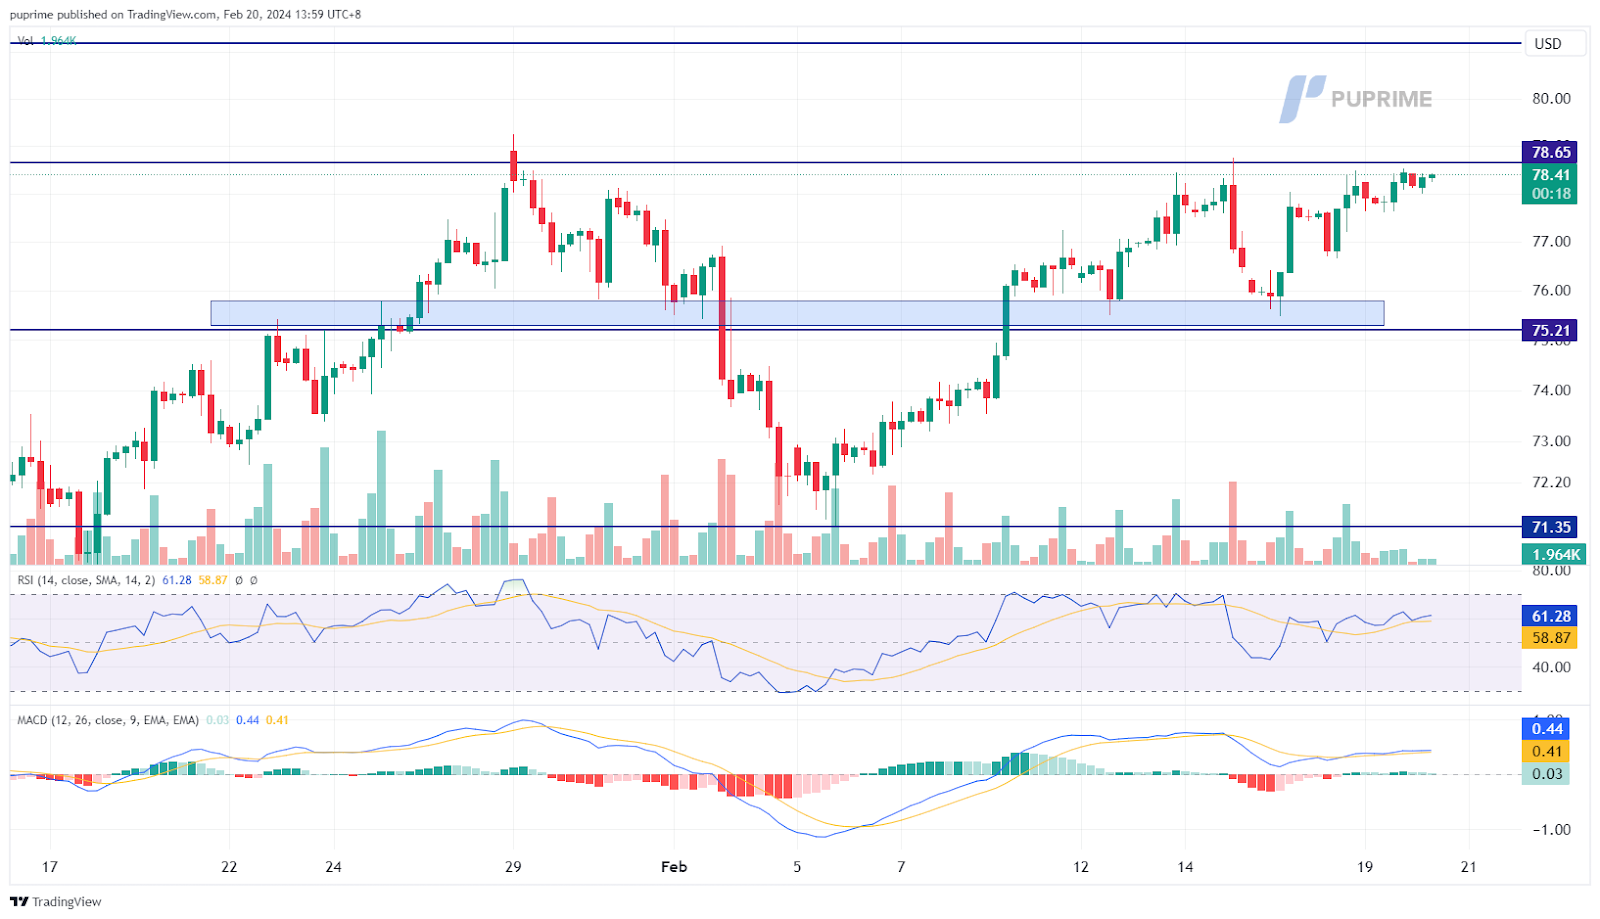
Crude oil prices are navigating a nuanced trajectory influenced by a confluence of divergent factors. On the positive side, encouraging signals from China hint at a potential economic recovery, counterbalanced by ongoing geopolitical tensions in the Middle East, heightening concerns of potential disruptions in oil supply chains. However, the recent cautionary note sounded by the International Energy Agency regarding a projected demand slowdown in 2024, coupled with economic contractions in the UK and Japan, introduces a discernible element of prudence in the oil market.
oil prices are exhibiting an upward trend, testing a critical resistance level. Yet, it is noteworthy that the Moving Average Convergence Divergence (MACD) has depicted a diminishing bullish momentum, and the Relative Strength Index (RSI) is positioned at 58. This suggests a potential technical correction for the commodity, especially considering the RSI’s notable retreat from overbought territory.
Resistance level: 78.65, 81.20
Support level:75.20, 71.35

Trade with simulated capital and earn real profits after you pass our trader assessment.

20 May 2025, 06:46 Gold Slips as Ceasefire Hopes Curb Safe-Haven Demand

7 May 2025, 03:59 Geopolitical Risks and FOMC Uncertainty Shake Global Markets

6 May 2025, 05:53 Dollar Dips, Gold Rallies on U.S.-Taiwan Risk


New Registrations Unavailable
We’re not accepting new registrations at the moment.
While new sign ups are unavailable, existing users can continue their challenges and trading activities as usual.
Disclaimer: This website exclusively provides proprietary trading services. We do not engage in any regulated activities, offer investment management services, or manage funds on behalf of external clients. Our trading activities are conducted solely with the firm's own capital, and we do not accept client deposits or manage client accounts. It's important to note that none of the services we provide should be construed as investment or financial services in accordance with applicable laws.
This website offers services related to professional skill and experience assessment, which determine your eligibility to trade with the firm's capital. The outcome of these services is inherently determined by your individual skill level and ability to perform within the trading requirements and objectives outlined for each service separately. Clients are strongly advised to thoroughly understand the requirements of the services before signing up for any.
The content provided on this website is for informational purposes only and does not constitute financial, investment, or trading advice. The information presented is based on sources believed to be reliable, but we do not guarantee its accuracy, completeness, or timeliness. We disclaim any liability for any loss or damage arising directly or indirectly from the use of or reliance on the information provided on this website.
This website is not directed to residents of certain jurisdictions such as the United States, Singapore, Australia, China and some other specified regions, and is not intended for distribution to, or use by, any person in any countries or jurisdictions where such distribution or use would be contrary to local law or regulation.
This website is owned by Finzero Cap Ltd, a company incorporated in the Republic of Cyprus under registration number HE414308, with its registered office at 62 Athalassas, Mezzanine, Strovolos 2012, Nicosia, Cyprus. Finzero Cap Ltd serves as the authorized representative for PU Prime Ltd.
