Join the PU Xtrader Challenge Today
Trade with simulated capital and earn real profits after you pass our trader assessment.
Join the PU Xtrader Challenge Today
Trade with simulated capital and earn real profits after you pass our trader assessment.
16 February 2024,03:22
Daily Market AnalysisMarket Insights
16 February 2024, 03:22
* Retail Sales came short, hammering the dollar.
* Gold and Oil prices surge on the soft U.S. dollar.
*Today’s PPI is focused on gauging the strength of the dollar.
The eagerly awaited U.S. Retail Sales figures failed to sustain the positive sentiment generated by the robust Consumer Price Index (CPI) reading disclosed last Tuesday. Despite a drop in Initial Jobless Claims to 212k from the previous 220k, the Retail Sales figure disappointed at -0.8%, marking its lowest point since January 2023. This has heightened expectations for a potential rate cut by the Federal Reserve in May. Investors are closely scrutinising today’s Producer Price Index (PPI) reading to glean insights into the potential direction of the U.S. dollar.
In the realm of commodities, both gold and oil prices experienced a noteworthy upswing, attributed to the weakened dollar. However, the International Energy Agency’s forecast of slowing demand growth for crude oil this year introduces a potential impediment to further surges in oil prices.
Against the backdrop of mixed U.S. economic data, the discernible surge in risk appetite is evident, exemplified by the ongoing rallies in both U.S. equity markets and the Nikkei, the Japanese stock index.
Current rate hike bets on 20th March Fed interest rate decision:
Source: CME Fedwatch Tool
0 bps (92%) VS -25 bps (8%)
(MT4 System Time)

Source: MQL5

The Dollar Index continued to retreat after the U.S. released mixed economic data but showed signs of recovery in Friday’s Asia market session. The U.S. retail sales number came short which hammering the dollar index to near $104 mark despite the Initial Jobless Claims data came better than market expectation. traders are keeping a close eye on today’s PPI reading to gauge the direction of the dollar.
The Dollar Index has found support near the $104 mark and rebounded from such levels. The RSI is hovering near the 50 level while the MACD continue to diverge and is approaching the zero line from above, suggesting the bullish momentum is easing.
Resistance level: 104.60, 105.70
Support level: 103.80, 103.00
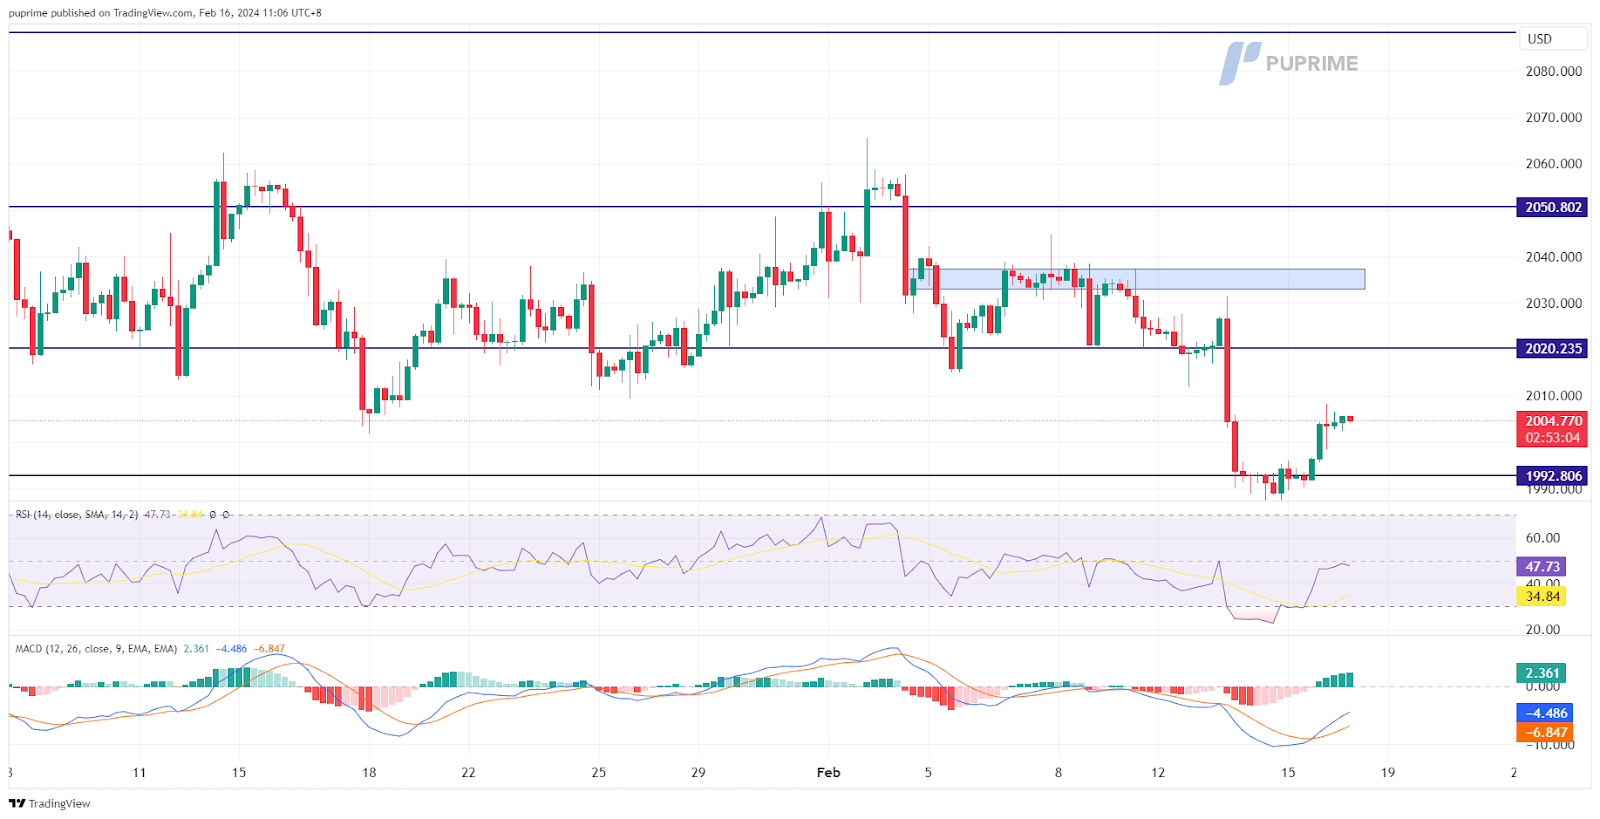
Gold prices underwent a notable rebound after a significant decline earlier in the week. This rebound can be attributed primarily to the softening of the U.S. dollar, a trend that ensued after the release of lacklustre Retail Sales numbers. The softer economic data has fueled expectations for an early rate cut by the Federal Reserve, thereby supporting the appeal of gold as a safe-haven asset. Furthermore, traders are closely monitoring developments in the Middle East tension as it could impact the strength of gold as a safe haven.
Gold prices form a morning-star candlestick pattern and suggest a potential trend reversal for gold. The RSI rose sharply to above 50 level while the MACD crossed at the bottom and is approaching the zero line, suggesting a bullish momentum is forming.
Resistance level: 2020.20, 2050.80
Support level: 1992.80, 1968.30
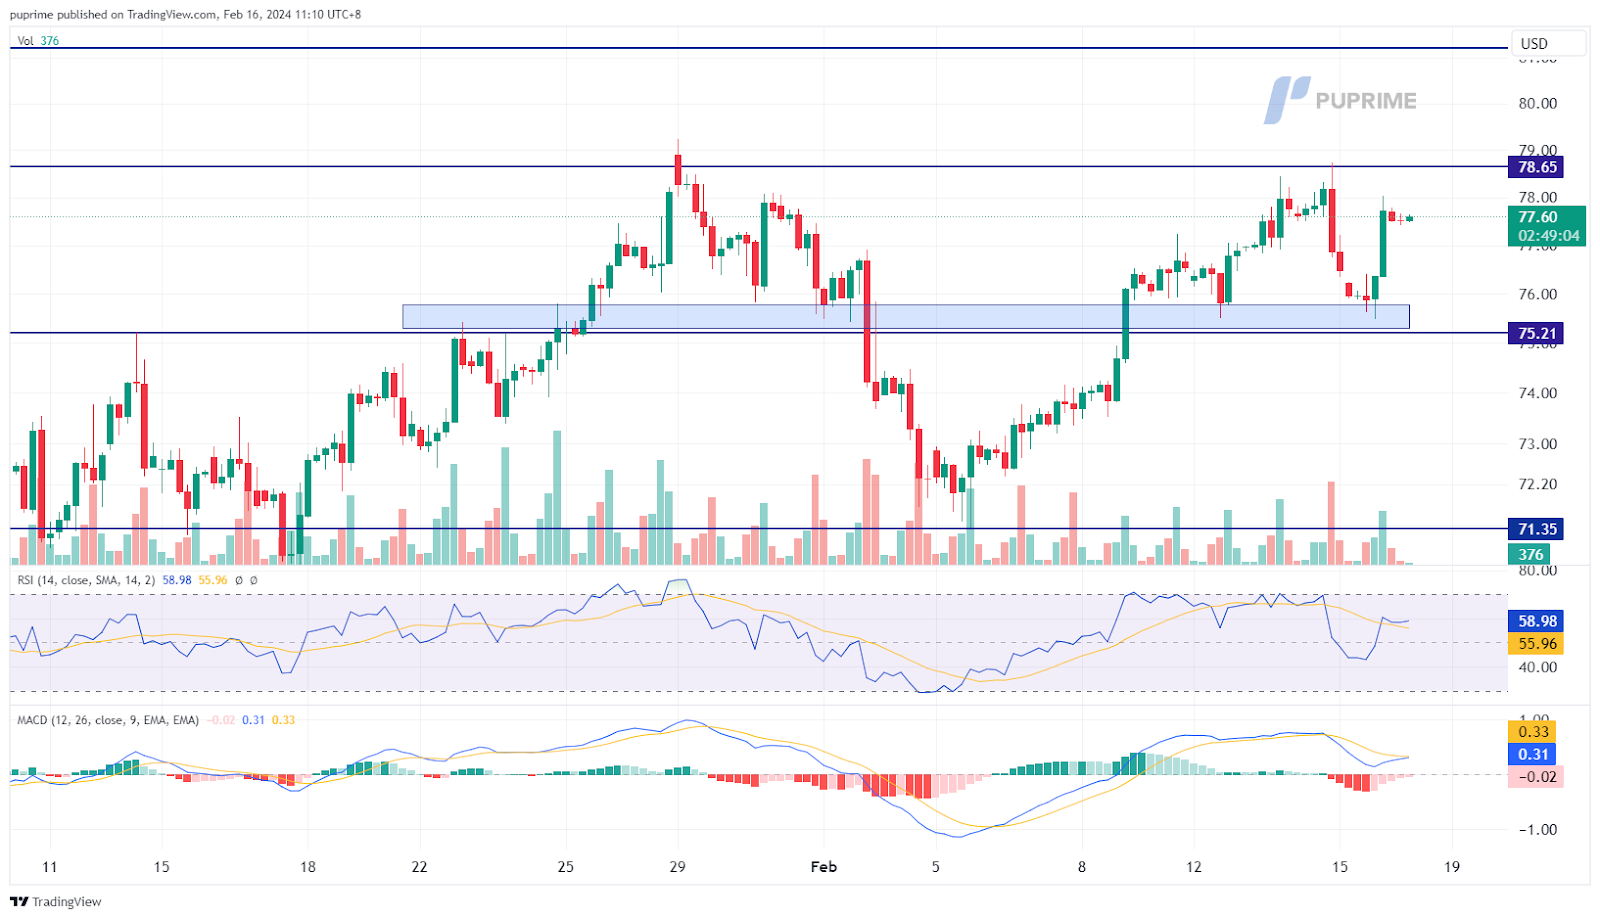
Oil prices demonstrated a sharp rebound, registering a gain of nearly 1% in the last session and trading above its liquidity zone. This suggests that the bullish momentum remains intact for oil prices. However, despite these gains, there is a shadow cast on the oil market as the International Energy Agency (IEA) has trimmed its 2024 oil demand growth forecast. This adjustment in demand forecasts adds an element of caution to the outlook for oil prices, notwithstanding the efforts made by the OPEC+ alliance to manage production levels.
Oil prices rebounded sharply and are approaching their strong resistance level at 78.65. The RSI remain at the upper region while the MACD flowing above the zero line suggests the bullish momentum remains intact with oil prices.
Resistance level: 78.65, 81.20
Support level:75.20, 71.35

Trade with simulated capital and earn real profits after you pass our trader assessment.

20 May 2025, 06:46 Gold Slips as Ceasefire Hopes Curb Safe-Haven Demand

7 May 2025, 03:59 Geopolitical Risks and FOMC Uncertainty Shake Global Markets

6 May 2025, 05:53 Dollar Dips, Gold Rallies on U.S.-Taiwan Risk


New Registrations Unavailable
We’re not accepting new registrations at the moment.
While new sign ups are unavailable, existing users can continue their challenges and trading activities as usual.
Disclaimer: This website exclusively provides proprietary trading services. We do not engage in any regulated activities, offer investment management services, or manage funds on behalf of external clients. Our trading activities are conducted solely with the firm's own capital, and we do not accept client deposits or manage client accounts. It's important to note that none of the services we provide should be construed as investment or financial services in accordance with applicable laws.
This website offers services related to professional skill and experience assessment, which determine your eligibility to trade with the firm's capital. The outcome of these services is inherently determined by your individual skill level and ability to perform within the trading requirements and objectives outlined for each service separately. Clients are strongly advised to thoroughly understand the requirements of the services before signing up for any.
The content provided on this website is for informational purposes only and does not constitute financial, investment, or trading advice. The information presented is based on sources believed to be reliable, but we do not guarantee its accuracy, completeness, or timeliness. We disclaim any liability for any loss or damage arising directly or indirectly from the use of or reliance on the information provided on this website.
This website is not directed to residents of certain jurisdictions such as the United States, Singapore, Australia, China and some other specified regions, and is not intended for distribution to, or use by, any person in any countries or jurisdictions where such distribution or use would be contrary to local law or regulation.
This website is owned by Finzero Cap Ltd, a company incorporated in the Republic of Cyprus under registration number HE414308, with its registered office at 62 Athalassas, Mezzanine, Strovolos 2012, Nicosia, Cyprus. Finzero Cap Ltd serves as the authorized representative for PU Prime Ltd.
