Join the PU Xtrader Challenge Today
Trade with simulated capital and earn real profits after you pass our trader assessment.
Join the PU Xtrader Challenge Today
Trade with simulated capital and earn real profits after you pass our trader assessment.
2 February 2024,05:16
Daily Market AnalysisMarket Insights
2 February 2024, 05:16
U.S. equities rebounded on robust earnings, triggering positive momentum in Asian markets, including Hong Kong and China.
However, the dollar index faces challenges as it teeters near a critical $103 support level, intensifying uncertainty ahead of the impending Nonfarm Payroll report. This impending release becomes a focal point for market participants seeking crucial labor market insights that could potentially influence the trajectory of the dollar.
Simultaneously, oil prices are set to close the week with a 5% loss, signaling a de-escalation in Middle East tensions.
Current rate hike bets on 20th March Fed interest rate decision:
Source: CME Fedwatch Tool
0 bps (65%) VS -25 bps (35%)
(MT4 System Time)
Source: MQL5
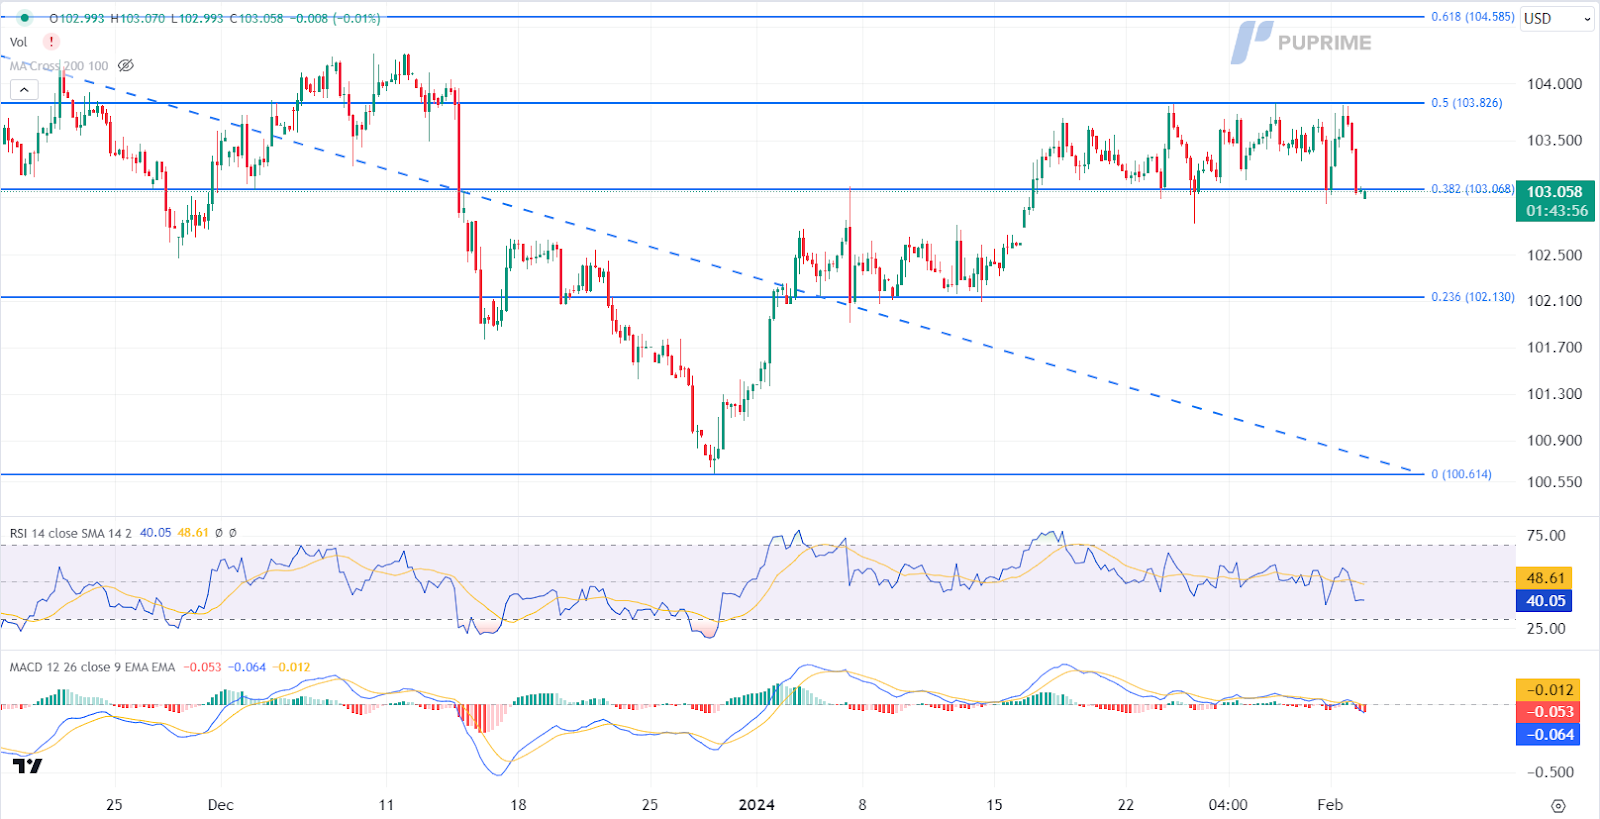
The Dollar Index experiences a decline driven by technical correction and profit-taking ahead of crucial US jobs data set to be released later today. Initial surges followed US Fed Chair Jerome Powell’s statement ruling out a March interest rate cut, citing a robust economic recovery. Traders are now recalibrating expectations, with a 39% probability of a March rate cut and a 94% chance of a reduction by May, according to the CME FedWatch Tool.
The Dollar Index is trading lower following the prior retracement from the resistance level. MACD has illustrated increasing bearish momentum, while RSI is at 40, suggesting the index might extend its losses since the RSI stays below the midline.
Resistance level: 103.85, 104.60
Support level: 103.05, 102.15
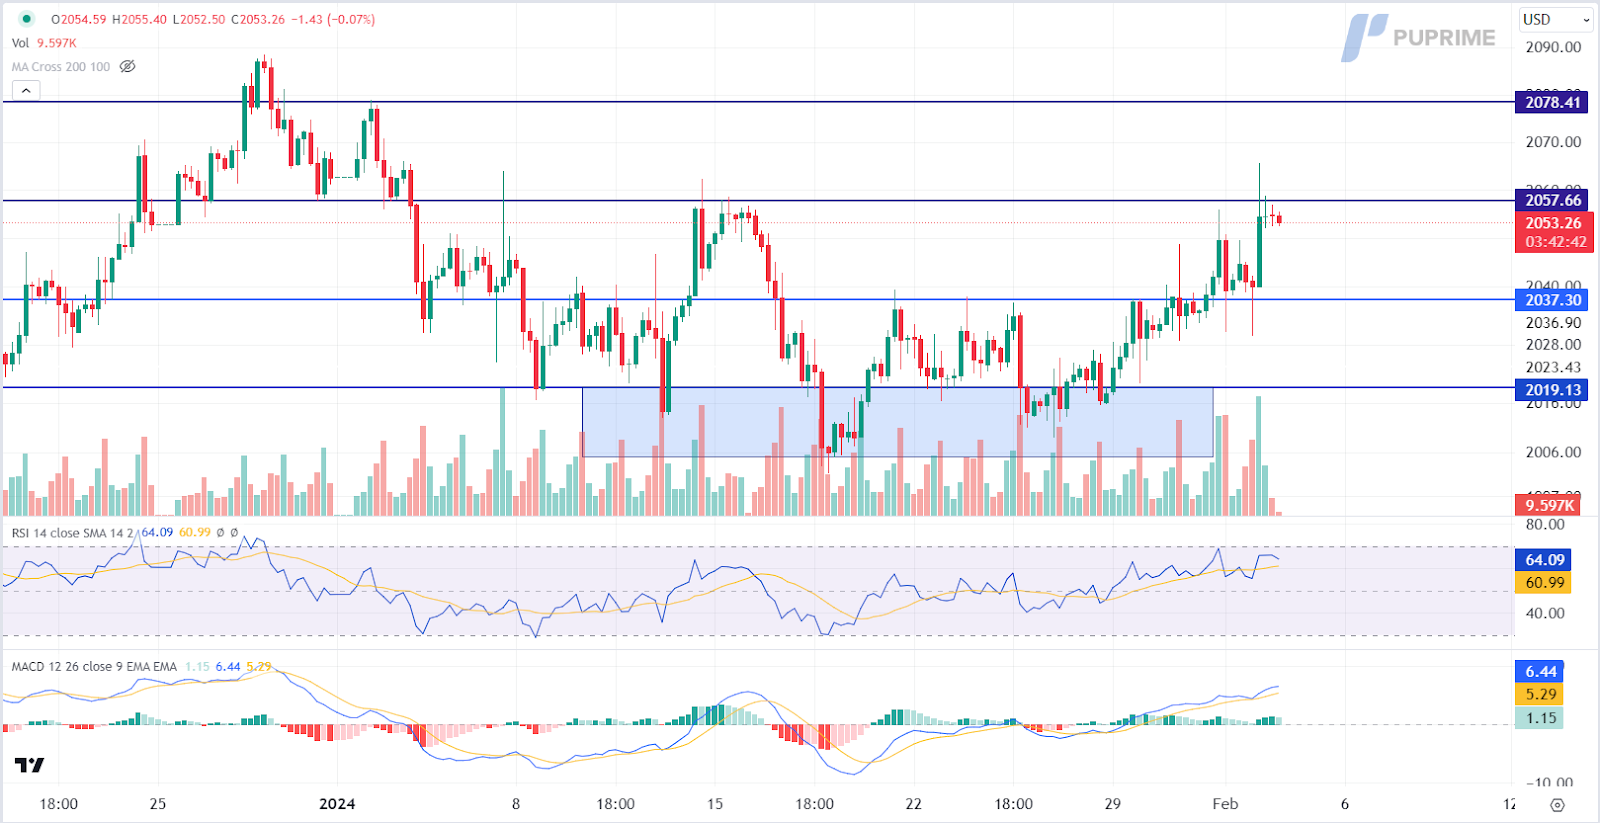
Following a hawkish Federal Reserve statement, US Treasury yields retreat, boosting gold’s appeal as investors shift focus to rising tensions in the Middle East. The US’s reprisal strikes against an Iranian-backed militia contribute to an atmosphere of geopolitical uncertainty, reinforcing gold’s safe-haven status.
Gold prices are trading higher while currently testing the resistance level. MACD has illustrated increasing bullish momentum, while RSI is at 64, suggesting the commodity might extend its gains after breakout since the RSI stays above the midline.
Resistance level: 2055.00, 2080.00
Support level: 2035.00, 2020.00
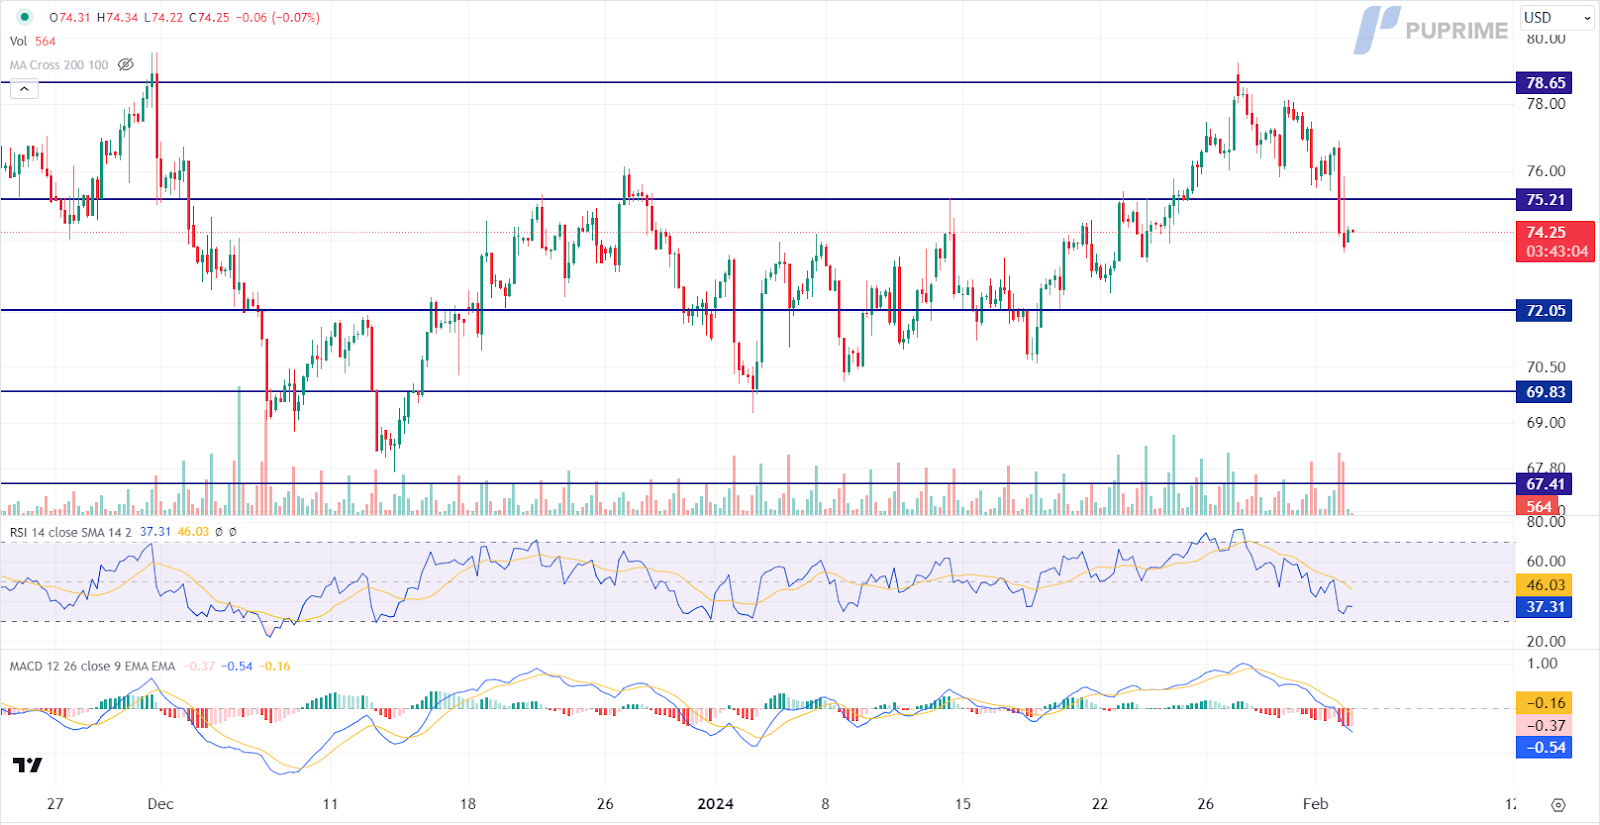
Oil prices tumble as hopes emerge for a resolution in the Israel-Hamas conflict, with reports of a proposal for an extended pause in fighting by Hamas. Meanwhile, the OPEC+ meeting shows limited price impact as the group refrains from changes to production policies, leaving markets to react to geopolitical developments.
Oil prices are trading lower following the prior breakout below the previous support level. MACD has illustrated increasing bearish momentum, while RSI is at 37, suggesting the commodity might extend its losses since the RSI stays below the midline.
Resistance level: 75.20, 78.65
Support level: 72.05, 69.85

Trade with simulated capital and earn real profits after you pass our trader assessment.

20 May 2025, 06:46 Gold Slips as Ceasefire Hopes Curb Safe-Haven Demand

7 May 2025, 03:59 Geopolitical Risks and FOMC Uncertainty Shake Global Markets

6 May 2025, 05:53 Dollar Dips, Gold Rallies on U.S.-Taiwan Risk


New Registrations Unavailable
We’re not accepting new registrations at the moment.
While new sign ups are unavailable, existing users can continue their challenges and trading activities as usual.
Disclaimer: This website exclusively provides proprietary trading services. We do not engage in any regulated activities, offer investment management services, or manage funds on behalf of external clients. Our trading activities are conducted solely with the firm's own capital, and we do not accept client deposits or manage client accounts. It's important to note that none of the services we provide should be construed as investment or financial services in accordance with applicable laws.
This website offers services related to professional skill and experience assessment, which determine your eligibility to trade with the firm's capital. The outcome of these services is inherently determined by your individual skill level and ability to perform within the trading requirements and objectives outlined for each service separately. Clients are strongly advised to thoroughly understand the requirements of the services before signing up for any.
The content provided on this website is for informational purposes only and does not constitute financial, investment, or trading advice. The information presented is based on sources believed to be reliable, but we do not guarantee its accuracy, completeness, or timeliness. We disclaim any liability for any loss or damage arising directly or indirectly from the use of or reliance on the information provided on this website.
This website is not directed to residents of certain jurisdictions such as the United States, Singapore, Australia, China and some other specified regions, and is not intended for distribution to, or use by, any person in any countries or jurisdictions where such distribution or use would be contrary to local law or regulation.
This website is owned by Finzero Cap Ltd, a company incorporated in the Republic of Cyprus under registration number HE414308, with its registered office at 62 Athalassas, Mezzanine, Strovolos 2012, Nicosia, Cyprus. Finzero Cap Ltd serves as the authorized representative for PU Prime Ltd.

