Join the PU Xtrader Challenge Today
Trade with simulated capital and earn real profits after you pass our trader assessment.
Join the PU Xtrader Challenge Today
Trade with simulated capital and earn real profits after you pass our trader assessment.
30 January 2024,06:11
Daily Market AnalysisMarket Insights
30 January 2024, 06:11
* Gold and oil prices surge amid Middle East tensions..
* U.S. equities rally pre-earnings, spotlight on mega-caps Microsoft, Apple, and Amazon.
* All attention on today’s release of Euro’s GDP.
Amidst a sideways trend in the U.S. dollar, market focus intensifies on the upcoming Federal Reserve interest rate decision and release of the FOMC meeting minutes. Investors eagerly await these events, seeking crucial insights into the potential monetary moves by the Federal Reserve, which will undoubtedly influence the dollar’s strength.
In the realm of precious metals, the gold market remains bullish, spurred by heightened geopolitical tensions following a lethal attack on U.S. troops in Jordan. This incident has dampened risk appetite, propelling investors towards the safe-haven allure of gold, highlighting the metal’s resilience as a hedge during uncertain times.
China’s impending release of its Purchasing Managers’ Index (PMI) data holds significance, offering a key glimpse into the economic outlook of the world’s largest oil importer. Investors are advised to closely monitor these indicators for potential market movements, aligning with Bloomberg’s data-centric approach to stay abreast of global economic shifts.
Current rate hike bets on 31 January Fed interest rate decision:
Source: CME Fedwatch Tool
0 bps (98%) VS -25 bps (2%)
(MT4 System Time)
Source: MQL5
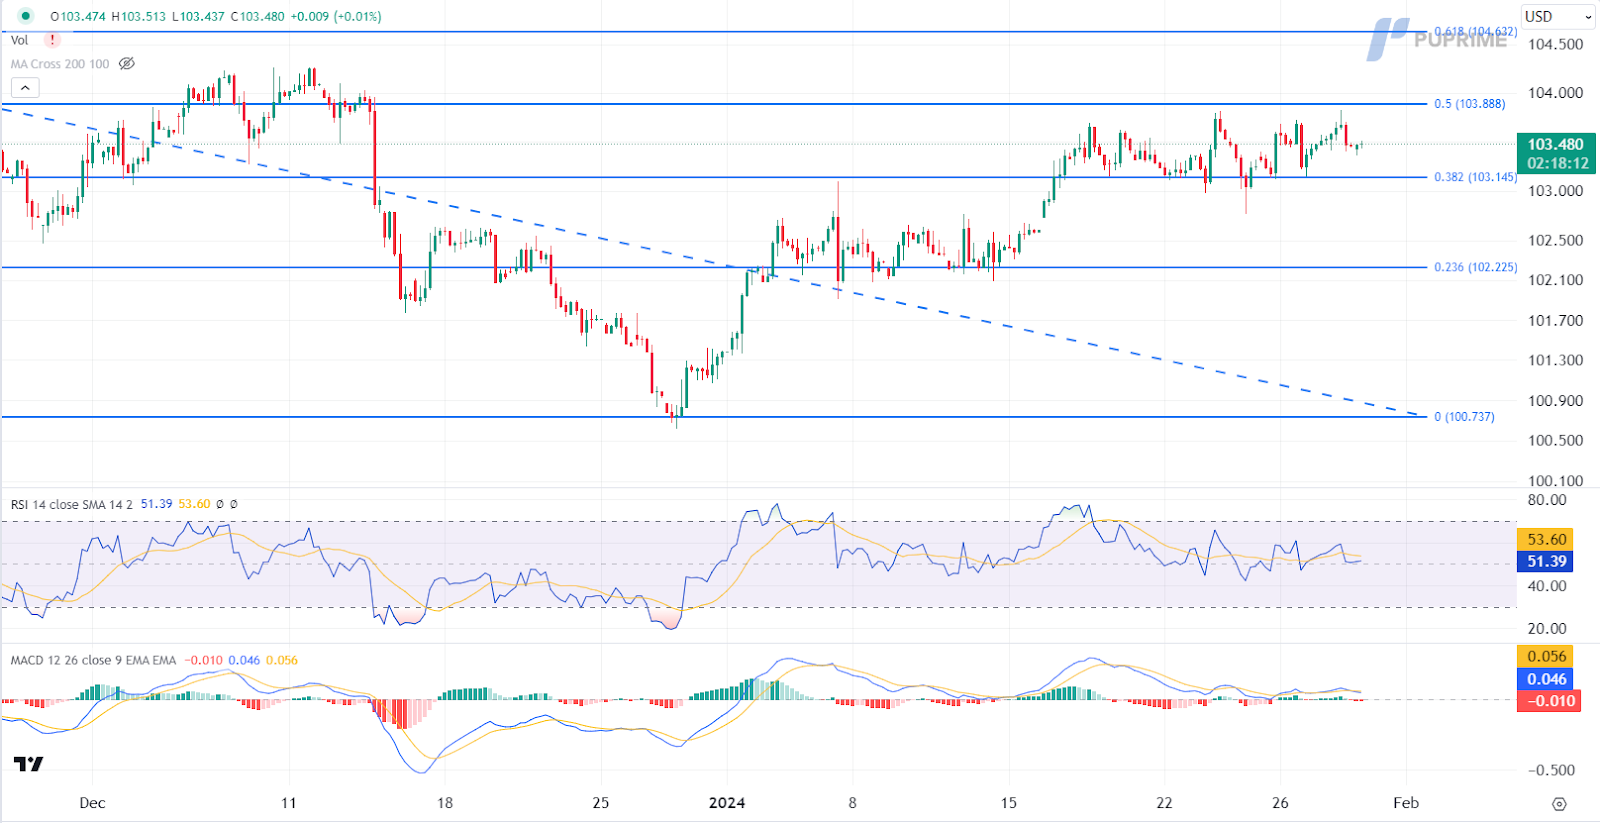
In the realm of the U.S. dollar, a recent breakout above resistance has led to a flat trend as investors await the Federal Reserve’s two-day meeting. Improved economic data has tempered expectations of rate cuts, yet uncertainties persist following a lackluster inflation report. Traders are now eyeing a 48% chance of a March rate cut, a notable decline from the previous month’s 89%, per the CME FedWatch Tool.
The Dollar Index continues to consolidate in a range. MACD has illustrated increasing bearish momentum, while RSI is at 52, suggesting the index might be consolidating in a range between support and resistance level since the RSI near the midline.
Resistance level: 103.90, 104.65
Support level: 103.15, 102.20
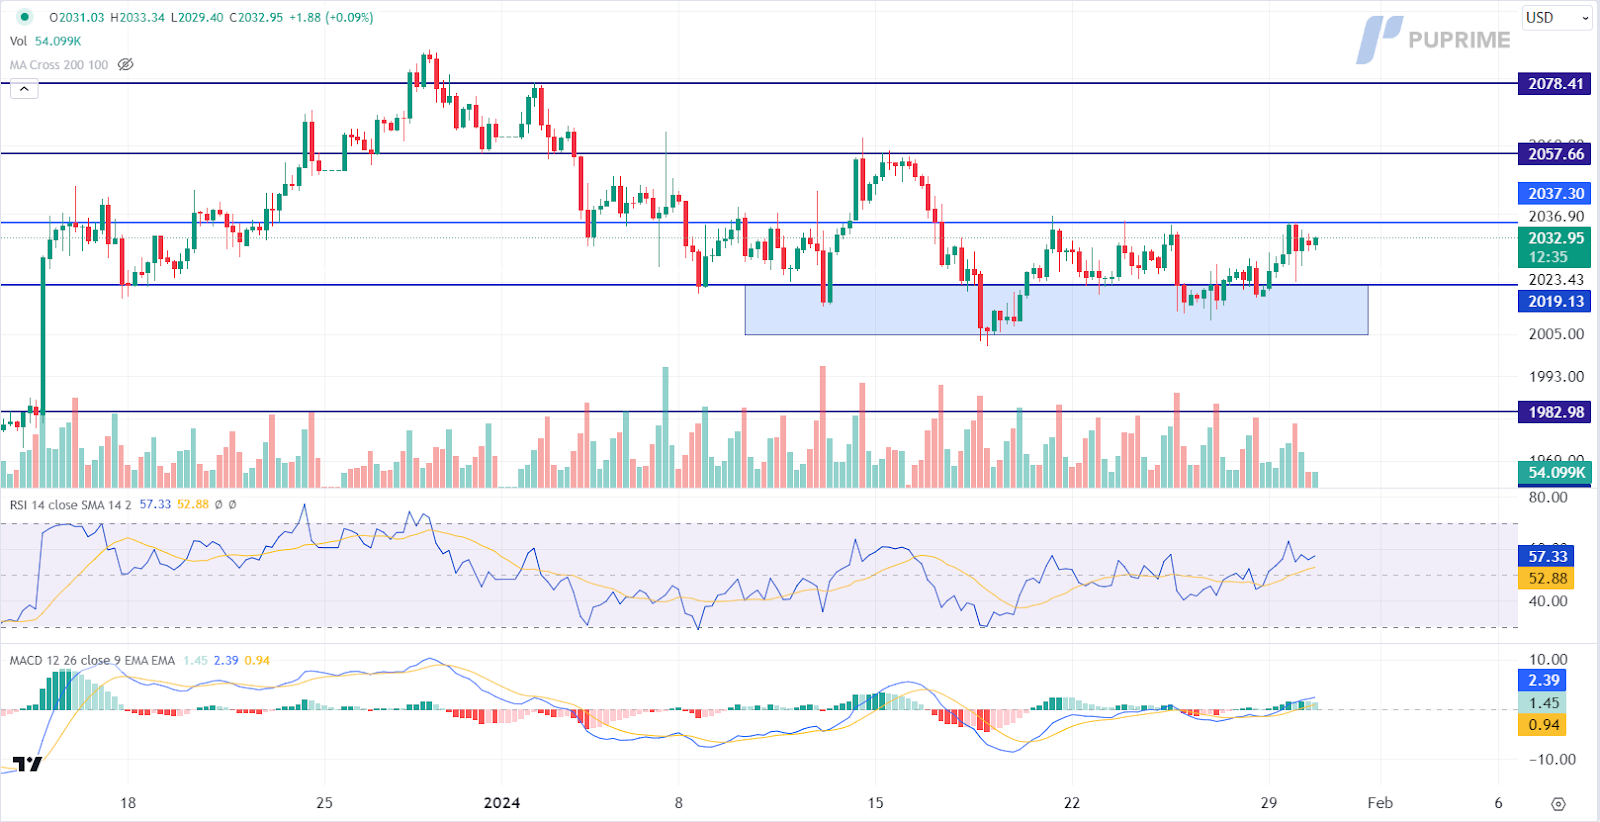
The recent surge in geopolitical tensions, triggered by a drone attack in Jordan resulting in the death of three US troops, has had a profound impact on the gold market. President Biden’s attribution of the attack to Iran-backed groups has heightened concerns, marking the first deadly strike against US forces since the Israel-Hamas war in October. These events have sent shock waves throughout the Middle East, creating an environment conducive to safe-haven assets such as gold.
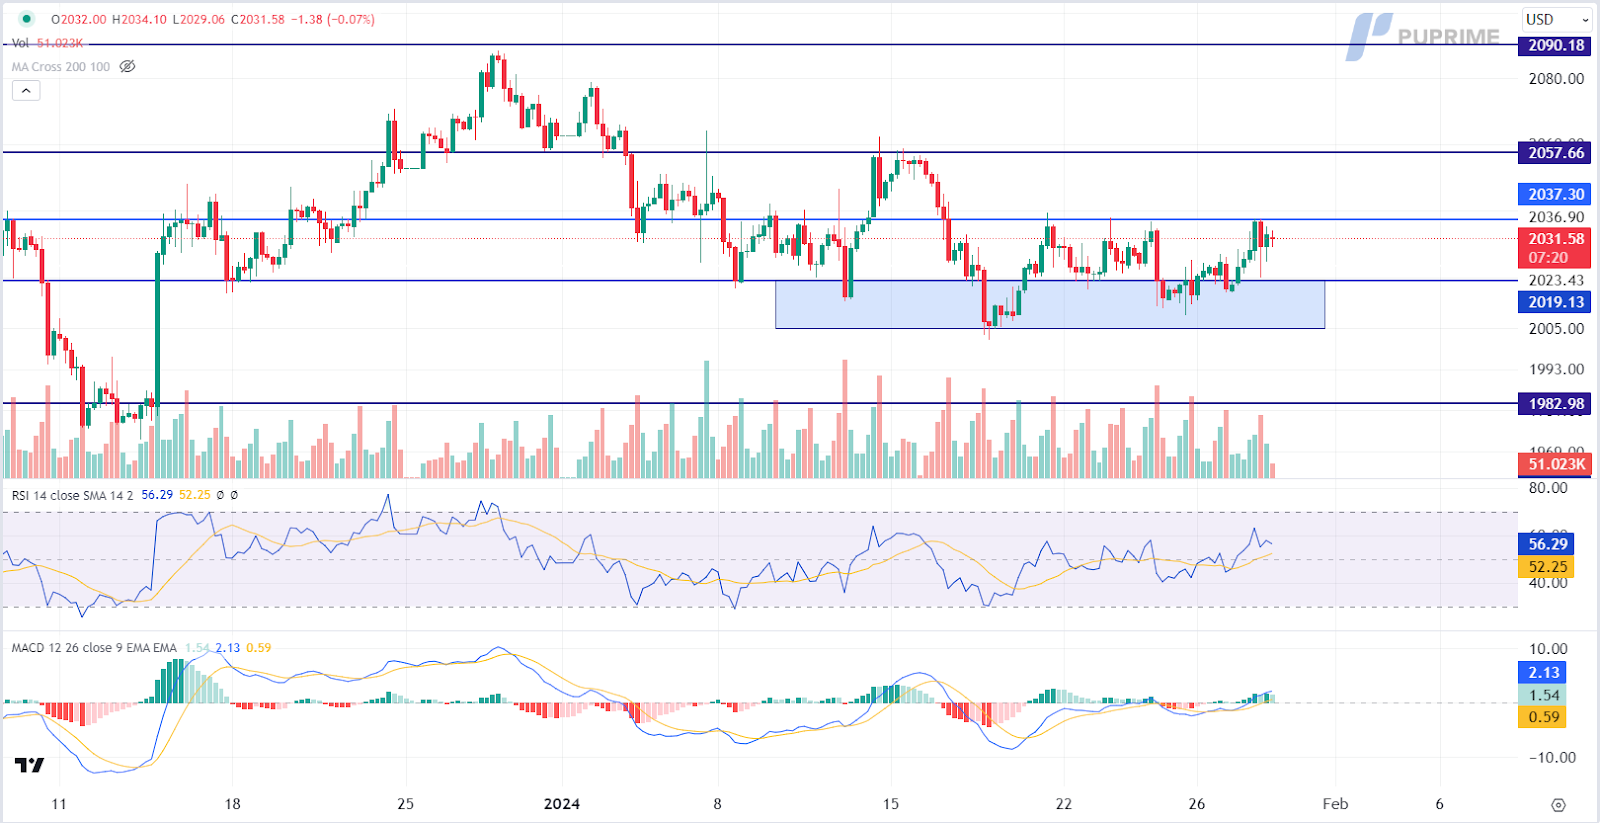
Gold prices hover near the critical resistance level of 2035.00, signalling a pivotal juncture for the commodity. The MACD reveals a surge in bullish momentum, amplifying the prospects of an extension in gains. With the RSI positioned at 57 and staying above the midline, the potential for a successful breakout further supports the outlook for continued upward movement in the gold market.
Resistance level: 2035.00, 2055.00
Support level: 2020.00, 1985.00
Oil prices have undergone a retreat, primarily driven by technical correction and profit-taking after a prolonged bullish trend. Concerns over China’s struggling property sector have compounded worries about demand, prompting a reassessment of the supply risk premium linked to Middle East tensions. Additionally, the prospect of major central banks adopting a slightly hawkish stance, fueled by positive economic data, further contributes to the nuanced and complex outlook for oil prices.
In the aftermath of the retracement from the resistance level, oil prices are currently trading lower. The MACD signals an increase in bearish momentum, indicating a potential continuation of losses. With the RSI at 59 and sharply retreating from overbought territory, there is an indication that the commodity might extend its decline.
Resistance level: 78.65, 80.00
Support level: 75.20, 70.25

Trade with simulated capital and earn real profits after you pass our trader assessment.

20 May 2025, 06:46 Gold Slips as Ceasefire Hopes Curb Safe-Haven Demand

7 May 2025, 03:59 Geopolitical Risks and FOMC Uncertainty Shake Global Markets

6 May 2025, 05:53 Dollar Dips, Gold Rallies on U.S.-Taiwan Risk


New Registrations Unavailable
We’re not accepting new registrations at the moment.
While new sign ups are unavailable, existing users can continue their challenges and trading activities as usual.
Disclaimer: This website exclusively provides proprietary trading services. We do not engage in any regulated activities, offer investment management services, or manage funds on behalf of external clients. Our trading activities are conducted solely with the firm's own capital, and we do not accept client deposits or manage client accounts. It's important to note that none of the services we provide should be construed as investment or financial services in accordance with applicable laws.
This website offers services related to professional skill and experience assessment, which determine your eligibility to trade with the firm's capital. The outcome of these services is inherently determined by your individual skill level and ability to perform within the trading requirements and objectives outlined for each service separately. Clients are strongly advised to thoroughly understand the requirements of the services before signing up for any.
The content provided on this website is for informational purposes only and does not constitute financial, investment, or trading advice. The information presented is based on sources believed to be reliable, but we do not guarantee its accuracy, completeness, or timeliness. We disclaim any liability for any loss or damage arising directly or indirectly from the use of or reliance on the information provided on this website.
This website is not directed to residents of certain jurisdictions such as the United States, Singapore, Australia, China and some other specified regions, and is not intended for distribution to, or use by, any person in any countries or jurisdictions where such distribution or use would be contrary to local law or regulation.
This website is owned by Finzero Cap Ltd, a company incorporated in the Republic of Cyprus under registration number HE414308, with its registered office at 62 Athalassas, Mezzanine, Strovolos 2012, Nicosia, Cyprus. Finzero Cap Ltd serves as the authorized representative for PU Prime Ltd.
