Join the PU Xtrader Challenge Today
Trade with simulated capital and earn real profits after you pass our trader assessment.
Join the PU Xtrader Challenge Today
Trade with simulated capital and earn real profits after you pass our trader assessment.
8 September 2023,05:44
Daily Market Analysis
8 September 2023, 05:44
U.S. economic data released on Thursday has reinforced the belief that the Federal Reserve may proceed with interest rate hikes on September 20th. This sentiment was supported by lower-than-expected initial jobless claims and a larger-than-anticipated decline in crude oil stockpiles last week. The U.S. dollar remains strong, hovering around the $105 level, while the equity market continues to experience declines, as the prospects of further monetary tightening weigh on investor sentiment. In addition to these economic factors, concerns about escalating trade tensions between the U.S. and China have prompted gold prices to rise during the Asian morning session. Meanwhile, U.S. nationwide crude supplies have reached their lowest levels since December, providing support for oil prices, which remain above $86.
Current rate hike bets on 20th September Fed interest rate decision:
Source: CME Fedwatch Tool
0 bps (93.0%) VS 25 bps (7.0%)
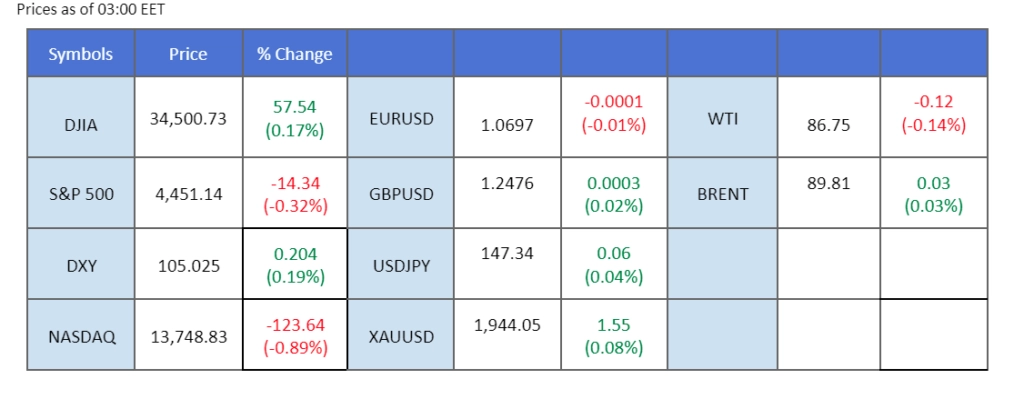

The US Dollar has maintained a firm position, supported by robust job market data. The Department of Labor reported a decline in Initial Jobless Claims from 229K to 216K, surpassing market expectations of 234K. This positive data has contributed to the greenback’s bullish trajectory. Investors are now eagerly awaiting the upcoming US inflation report, scheduled for release next week.
The dollar index extended its gains while currently testing the resistance level. However, MACD has illustrated increasing bearish momentum, while RSI is at 72, suggesting the index might enter overbought territory.
Resistance level: 105.25, 106.25
Support level: 104.25, 103.05
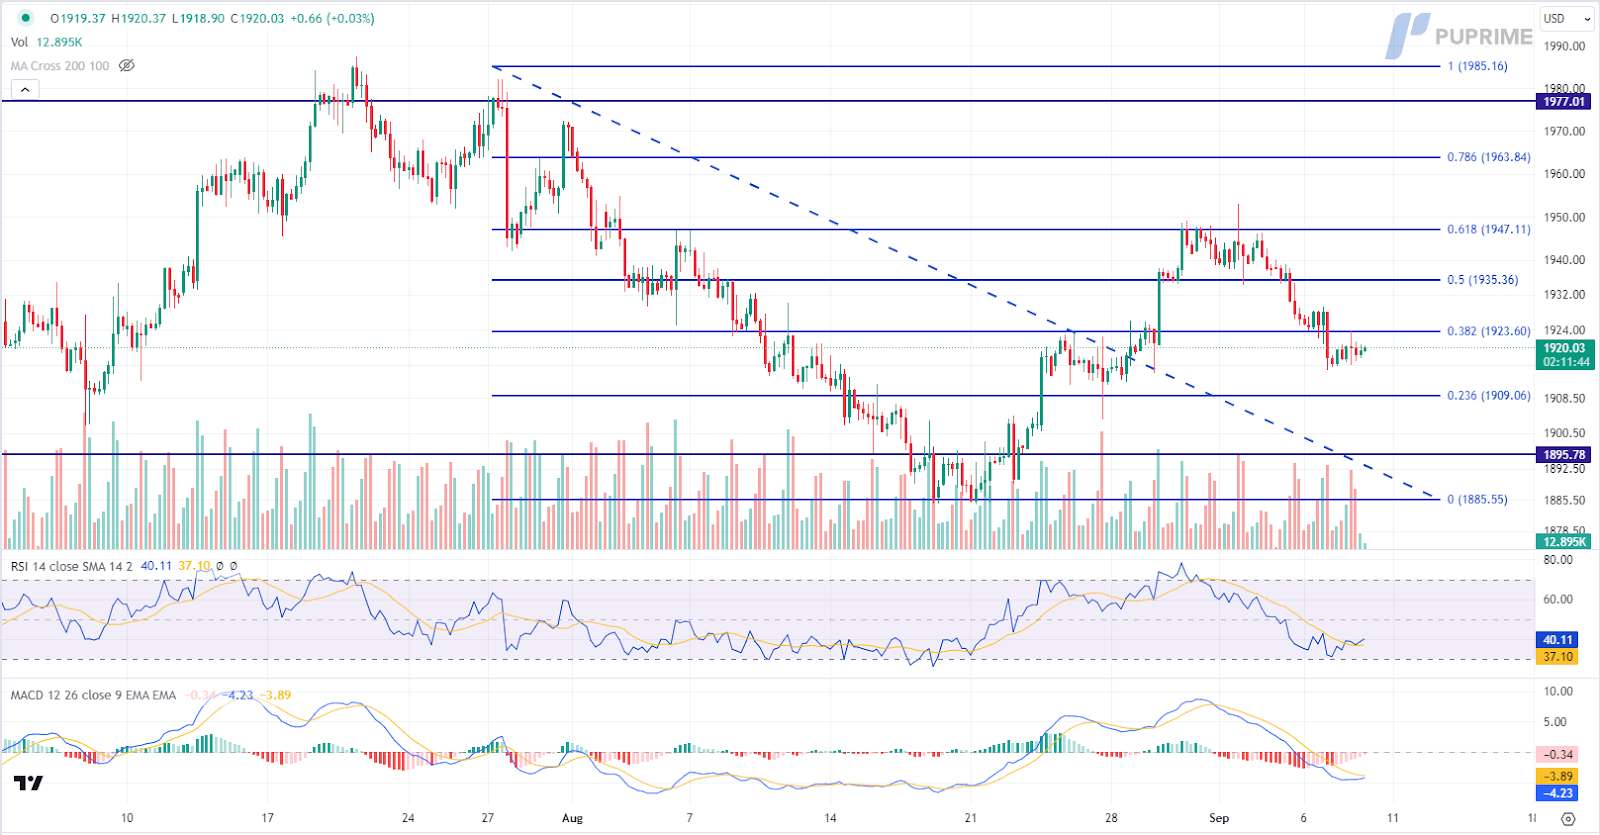
Gold prices have exhibited a stagnant performance lately, reflecting a lack of compelling market catalysts. Investors remain watchful, with a keen eye on next week’s inflation data, which could provide fresh trading signals. However, the prevailing sentiment in the gold market leans towards bearishness. This sentiment shift is underpinned by better-than-expected job data, including Nonfarm Payroll and Initial Jobless Claims.
Gold prices are trading flat while currently near the resistance level. However, MACD has illustrated diminishing bearish momentum, while RSI is at 40, suggesting the commodity might be traded higher as technical correction since the RSI rebounded sharply from oversold territory.
Resistance level: 1925.00, 1935.00
Support level: 1910.00, 1895.80
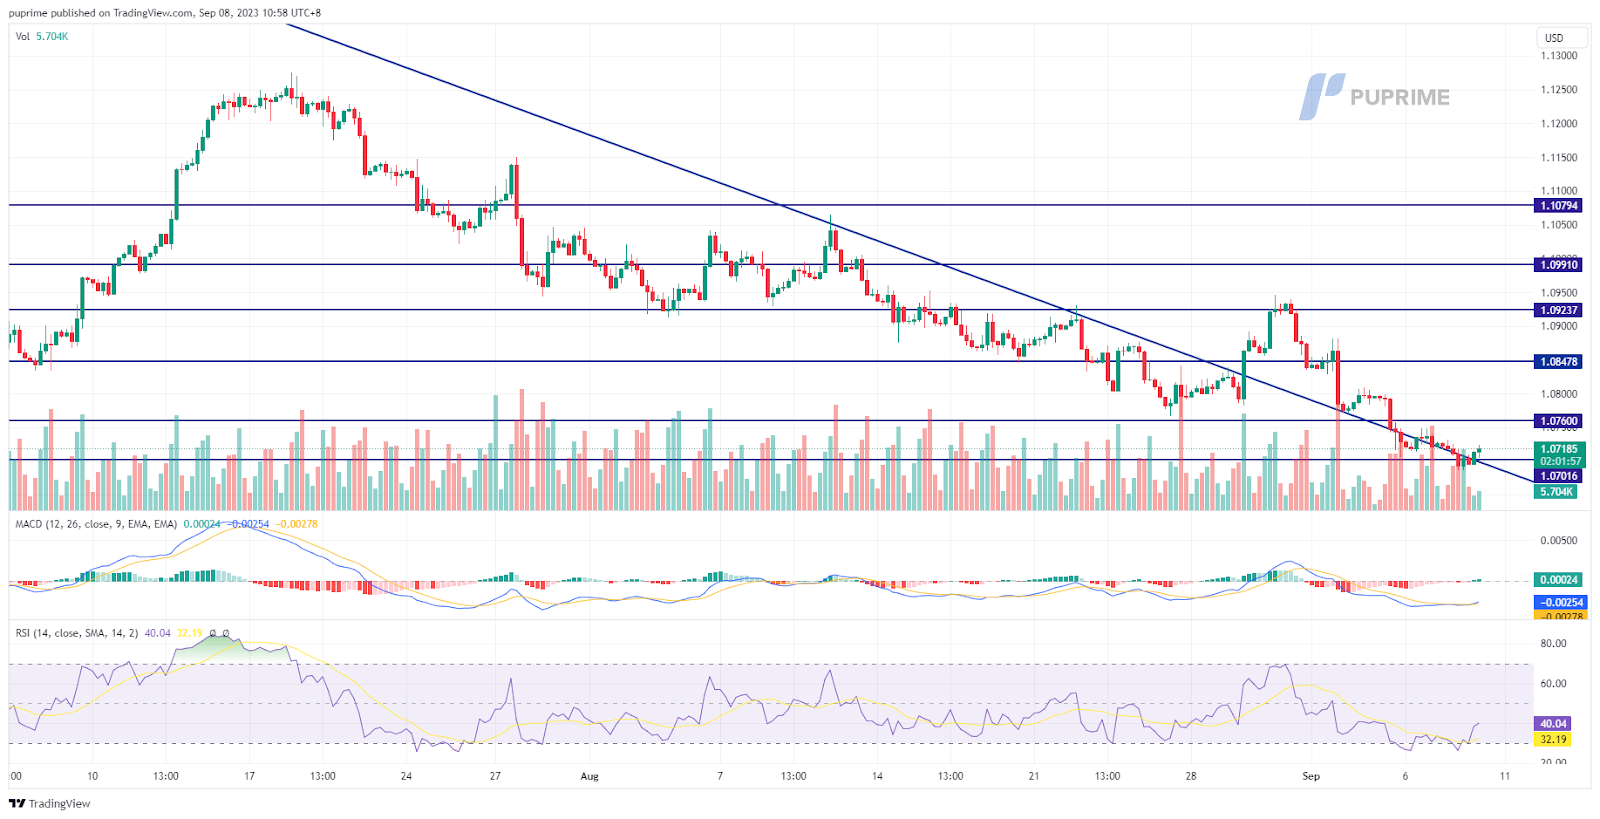
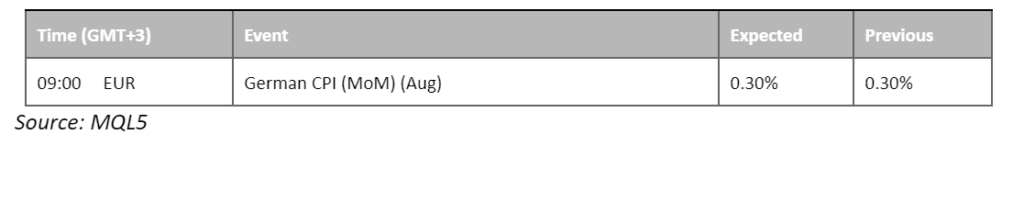
The euro remains under downward pressure as the U.S. dollar strengthens, supported by better-than-expected economic data. However, the Eurozone’s recently released GDP figures indicate that economic growth in the euro area is expanding at a slower pace than expected. This has resulted in expectations of the EUR/USD pair trading in a sluggish trend, despite a hawkish stance from the European Central Bank (ECB).
The EUR/USD has eased from its bearish trend and found support at the 1.0700 level. The RSI has sign to rebound from above the oversold zone while the MACD has crossed below, suggesting a potential technical rebound for the pair.
Resistance level: 1.0760,1.0850
Support level: 1.0700, 1.0640

The Canadian dollar continues to grapple with headwinds, driven by the Bank of Canada’s recent monetary policy statement. While the central bank has maintained its benchmark interest rate, it remains resolute in its pessimistic outlook for the Canadian economy. Lower GDP growth and inflation projections underscore the prevailing economic challenges, adding further pressure on the Canadian dollar.
USD/CAD is trading higher following the prior breakout above the previous resistance level. MACD has illustrated increasing bullish momentum, while RSI is at 65, suggesting the pair might extend its gains toward resistance level since the RSI stays above the midline.
Resistance level: 1.3790, 1.3925
Support level: 1.3640, 1.3510
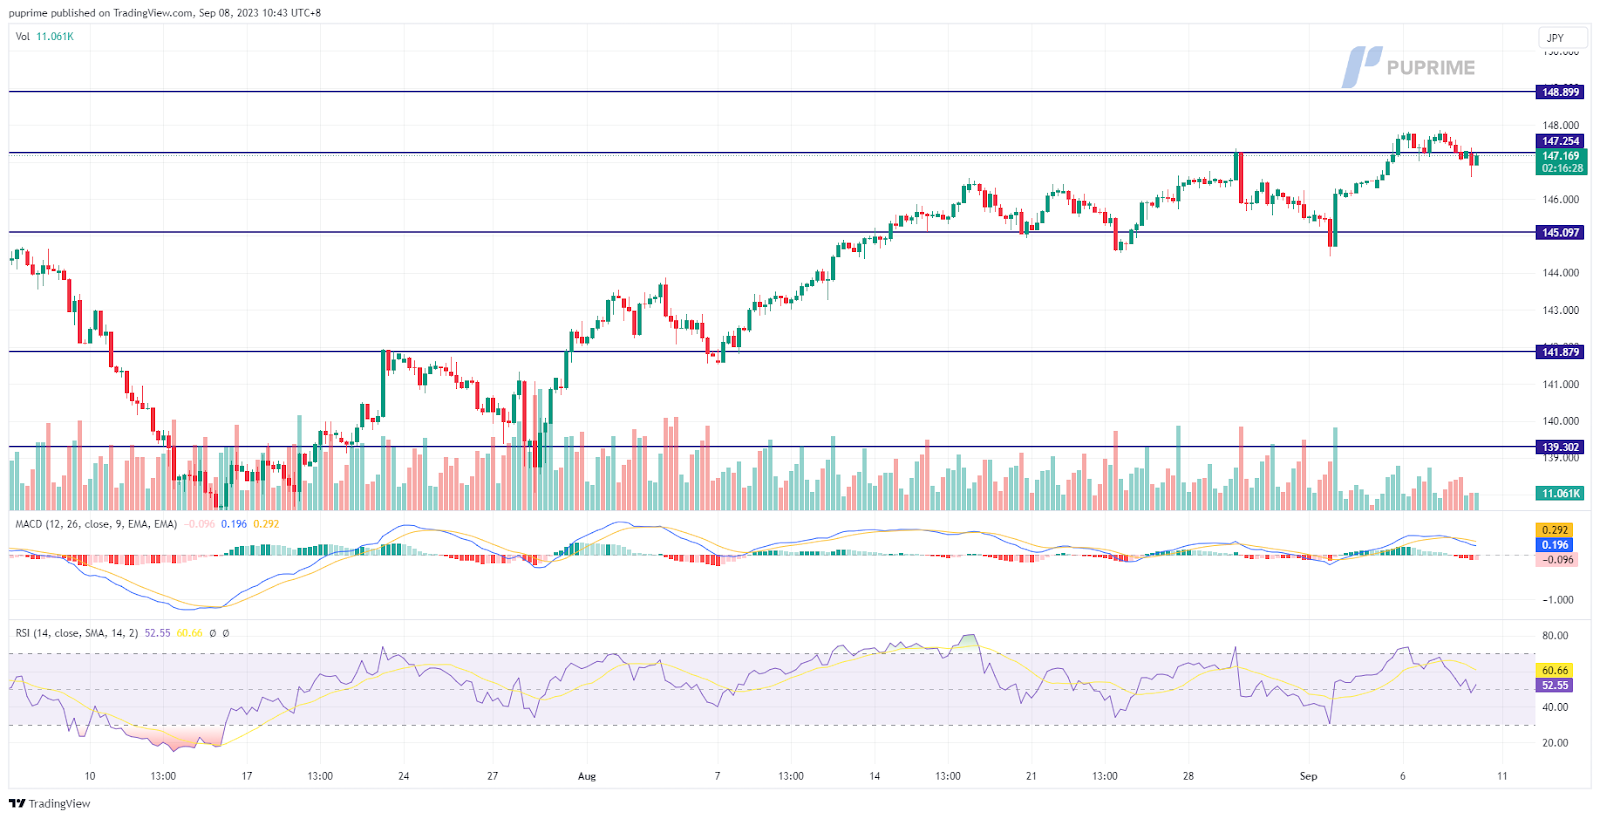
While the U.S. dollar has maintained its strength, supported by recent better-than-expected economic data, this has further solidified expectations of additional interest rate hikes from the Federal Reserve. However, the Japanese yen experienced gains during the Asian opening session, driven by comments from Japan’s Finance Minister. Top Japanese officials have stated that rapid currency movements are undesirable, and they wouldn’t rule out any options to counter excessive movements. This statement has led to market speculation that the Japanese authorities may intervene in the foreign exchange market to bolster the yen.
USD/JPY form a double top near 147.80 signalling a potential technical retracement. The MACD has crossed on the above while the RSI has declined sharply to the 50-level show that the bullish momentum is diminishing fast.
Resistance level: 148.90, 151.45
Support level: 145.10, 141.88

The Nasdaq Composite Index has experienced a continued downward trajectory, primarily driven by Apple Inc. The tech giant saw its stock price plummet by 2.90% yesterday, marking the second consecutive day of losses. The catalyst behind this downturn is the escalated restrictions imposed by the Chinese government on iPhone usage among state employees. Notably, certain central government agencies have mandated that their staff cease using mobile devices during work hours, further exacerbating concerns.
Nasdaq is trading lower following the prior retracement from the resistance level. MACD has illustrated diminishing bullish momentum, while RSI is at 51, suggesting the index might extend its losses since the RSI retreated sharply from overbought territory.
Resistance level: 15780.00, 16585.00
Support level: 14610.00, 13660.00

The Australian dollar has found support around the 0.6370 level after trading sluggishly since mid-July. Recent economic data from both Australia and China, two major trading partners, has been worse than expected, which has negatively impacted the currency values of both countries. However, there are hopes that high-level trade talks scheduled for today between the two nations could provide some relief and potentially strengthen the Aussie dollar.
The AUD/USD pair has been consolidating since Tuesday and has signs of a potential technical rebound. The RSI is moving upward and the MACD is moving toward the zero line, suggesting the beamish momentum has eased.
Resistance level: 1.2570, 1.2650
Support level: 1.2460, 1.3900
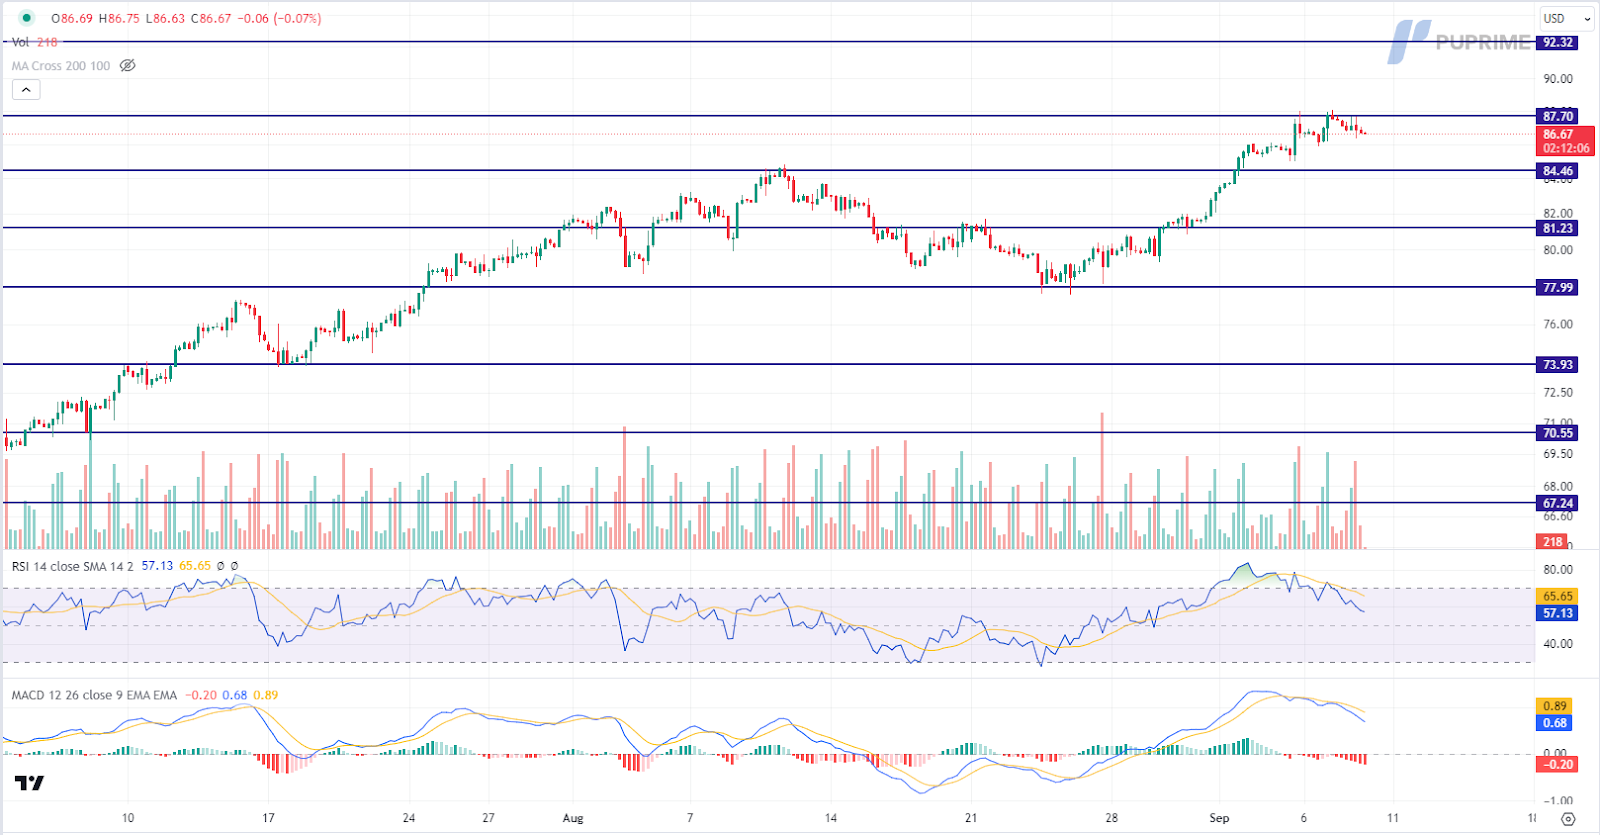
Despite a slight retreat in oil prices, the long-term outlook for the commodity remains bullish. OPEC+ has extended its production cuts, and bullish oil inventory data continues to bolster confidence. The Energy Information Administration (EIA) reported a substantial decline of -6.307 million barrels in US crude oil inventories, exceeding market projections of -2.064 million barrels.
Oil prices are trading lower following the prior retracement from the resistance level. MACD has illustrated increasing bearish momentum, while RSI is at 57, suggesting the commodity might extend its losses toward support level.
Resistance level: 87.70, 92.30
Support level: 84.45, 81.25

Trade with simulated capital and earn real profits after you pass our trader assessment.

20 May 2025, 06:46 Gold Slips as Ceasefire Hopes Curb Safe-Haven Demand

7 May 2025, 03:59 Geopolitical Risks and FOMC Uncertainty Shake Global Markets

6 May 2025, 05:53 Dollar Dips, Gold Rallies on U.S.-Taiwan Risk


New Registrations Unavailable
We’re not accepting new registrations at the moment.
While new sign ups are unavailable, existing users can continue their challenges and trading activities as usual.
Disclaimer: This website exclusively provides proprietary trading services. We do not engage in any regulated activities, offer investment management services, or manage funds on behalf of external clients. Our trading activities are conducted solely with the firm's own capital, and we do not accept client deposits or manage client accounts. It's important to note that none of the services we provide should be construed as investment or financial services in accordance with applicable laws.
This website offers services related to professional skill and experience assessment, which determine your eligibility to trade with the firm's capital. The outcome of these services is inherently determined by your individual skill level and ability to perform within the trading requirements and objectives outlined for each service separately. Clients are strongly advised to thoroughly understand the requirements of the services before signing up for any.
The content provided on this website is for informational purposes only and does not constitute financial, investment, or trading advice. The information presented is based on sources believed to be reliable, but we do not guarantee its accuracy, completeness, or timeliness. We disclaim any liability for any loss or damage arising directly or indirectly from the use of or reliance on the information provided on this website.
This website is not directed to residents of certain jurisdictions such as the United States, Singapore, Australia, China and some other specified regions, and is not intended for distribution to, or use by, any person in any countries or jurisdictions where such distribution or use would be contrary to local law or regulation.
This website is owned by Finzero Cap Ltd, a company incorporated in the Republic of Cyprus under registration number HE414308, with its registered office at 62 Athalassas, Mezzanine, Strovolos 2012, Nicosia, Cyprus. Finzero Cap Ltd serves as the authorized representative for PU Prime Ltd.
